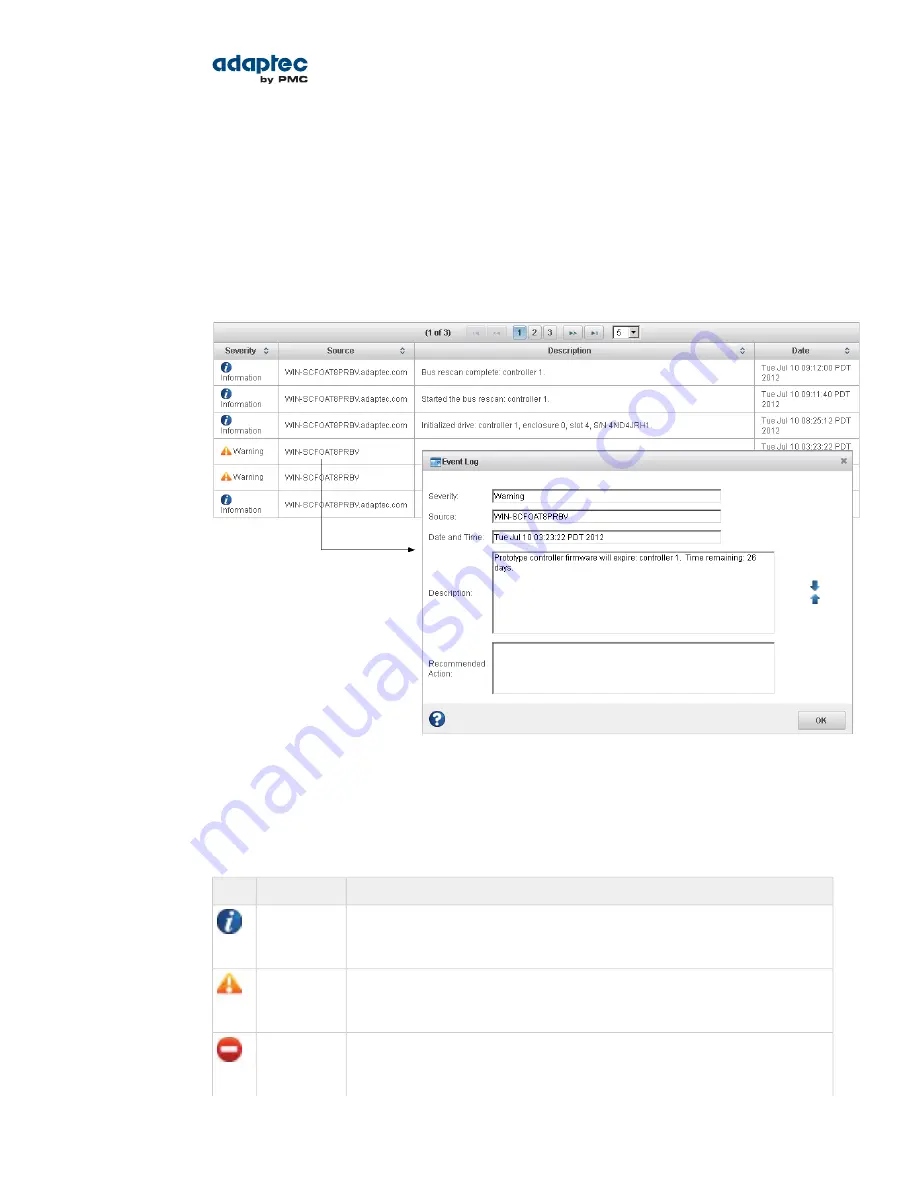
Viewing Activity Status in the Event Log
The Event Log lists activity occurring in your storage space, with the most recent event listed at the top.
Status is indicated by icons (see
What Do the Event Status Icons Mean?
on page 87) in the left-hand
column, as shown in the figure below.
You can view events as they occur in the bottom panel of the maxView Storage Manager main window.
The main window displays the last 100 events in your storage space. To view more events, filtered by
device (a controller, for example), open the Event tab on the Storage Dashboard (see
Viewing Component
Status in the Storage Dashboard
on page 88).
Single-click any event to open the Event Log Detail window to see more information in an easier-to-read
format. Use the up and down arrows to view previous or following events.
Single-click to view
event details.
To make it easier to find a specific event, click on the column heads to sort the events. For example,
sorting the events by Severity can help you find specific Error- or Warning-level events quickly.
What Do the Event Status Icons Mean?
maxView Storage Manager indicates event status with icons. This table lists the three categories, or
types, of events based on severity.
Examples
Status
Icon
The local system successfully connected to a remote system.
Information
A logical drive was created.
A hot spare was deleted.
A logical drive is in a degraded state.
Warning
A disk drive is being rebuilt.
A controller is not responding to an enclosure.
A controller has failed.
Error
A logical drive has failed.
A disk drive or hot spare has failed.
87
Proprietary and Confidential to PMC-Sierra, Inc.
Document No.: CDP-00278-01-A Rev. A, Issue:
maxView Storage Manager User's Guide


