


Start-Up & Operation 5 - 6
PN25080
TRIO-WIRL INSTRUCTION MANUAL
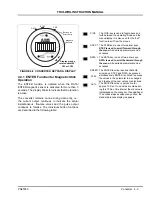
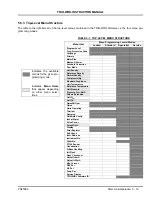
5.3.2.2 Calibration K-Factor
The median (average) k-Factor value is displayed by
navigating to the above menu item and pressing
Enter
.
Each flowmeter is calibrated on a test stand at 5 flow-
rate values. The 5 calibration factors are entered into
the converter and recorded on a calibration report and
on a paper tag located in the customer connection lid.
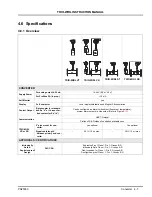
Typical calibration factor values and the signal frequen-
cies for liquids and gases are listed in the following
table. These values are approximate guidelines only:
Vortex Flowmeter TRIO-WIRL V
Swirl Flowmeter TRIO-WIRL S
The converter calculates the actual flowrate using the follow-
ing equations:
Q =
Where:
Q= Actual flowrate at operating conditions [m
3
/s]
f = Frequency [1/s]
k = Calibration k-Factor [1/m
3
]
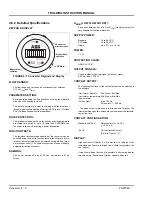
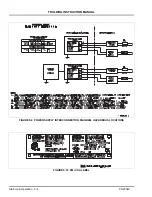
5.3.2.3 Current Output
The measurement value output characteristic for the
current output is shown in Figure
. Above the Qmin
(operating mode) value the curve is a straight line
whose value at 4 mA is Q = 0 and whose value at 20
mA is the value of Q
max
(operating mode). The current
output for flowrates less than the low flow cutoff value
Q
min
is set 4 mA equivalent to Q = 0.
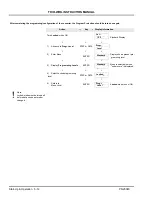
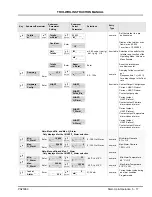
5.3.2.4 Hardware Configuration
The function assigned to the contact output (terminals
41 & 42) is selected in this submenu. The menus
Pulse
width
,
Min and Max Q_Alarm
or
Min and Max
T_Alarm
are displayed based on the selection of the
output function. „
Meter Size
Inch DN
Typ.
k-Factor
max [1/m
3
]
Liquid
f
max
at
Q
vmax
[Hz]
Gas
f
max
at
Q
vmax
[Hz]
1/2
15
30000
450
1840
1
25
80000
400
1825
1-1/2
40
21100
280
2000
2
50
10000
180
1250
3
80
2900
130
760
4
100
1300
80
650
6
150
380
55
425
8
200
166
43
310
10
250
66
28
235
12
300
39
23
190
Meter Size
Inch DN
Typ.
k-Factor
max [1/m
3
]
Liquid
f
max
at
Q
vmax
[Hz]
Gas
f
max
at
Q
vmax
[Hz]
1/2
15
440000
185
1900
1
25
86000
135
1200
1-1/4
32
33000
107
1300
1-1/2
40
21000
110
1400
2
50
11100
90
1200
3
80
2900
78
690
4
100
1620
77
700
6
150
460
50
470
8
200
194
30
330
12
300
54
16
160
16
400
upon request
13
150
Median
k-Factor
FIGURE 5-13 OUTPUT CURRENT
CHARACTERISTICS
Selections
Contact Output
Function
Menus
Displayed
I/HART
None
None
I/HART/Pulse_Bin
Pulse output
Pulse width
I/HART/Q_Alarm_
Flow alarm
Min. and Max.
Q_Alarm
I/HART/T_Alarm_
Temperature alarm
Min. and Max.
T_Alarm
I/HART/S_Alarm_
System alarm
None
f
k
---