P O Box 159 • Crestwood, KY 40014 • (877) 243-0042 • (502) 243-0039 fax
Drop-Down Tabs
1.
The ‘File’, ‘Setup’, 'View, 'Current Readings', and ‘Help’ tabs:
a.
File
i.
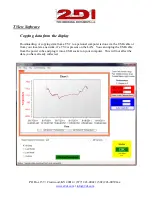
New Chart. This creates an empty chart with new tab to the right of any
already displayed tabs. The tab and chart description can be changed by
double clicking on the tab and typing the new name in the text box.
Multiple charts, each with its own tab can be created.
ii.
Open Chart. This command allows the user to open a file previously saved
and stored on a computer. You will be prompted for a file name. Only
files with a file extension of TXV can be opened. You must enter a
Username and Password if the chart was originally saved with a Username
and Password (see iii below).
Note: It is not possible to load the same file into more than one chart
or to change any part of a file displayed in TView.
iii.
Save Chart. This saves the active chart to your computer
.
The saved chart
will be encrypted and have a TXV suffix. It is encrypted with the
username and password you entered when the program was opened.
iv.
Export Chart to .XLS. This exports the chart shown on the active tab to an
XLS file that can be opened with Microsoft's Excel. Each sensor's data
will be transferred to a separate worksheet on the Excel chart. It is possible
to change this data in Excel.
v.
Print Chart. Sends the active chart to a printer. If there is more than one
plot on the chart, you should use a color printer so you can tell the plots
apart from each other. The chart looks better in landscape mode that
portrait mode.
vi.
Close chart. This immediately erases the selected chart and deletes it from
your computer. You will be given a chance to save the displayed chart.
vii.
Run in System Tray. This minimized the TView program and moves it to
the background. This is useful if you are auto-downloading to your
computer and want to leave the program running without seeing it on your
desktop.
viii.
Exit. This closes the program and stops any further activity.

