YSI 550A Manual Download Page 14

       21 

Water Action Volunteers – Level 2 Manual 

Updated January 2016 

Transparency Tube 

Sample Collection 

Collect the sample away from the stream bank in the main flow (well-mixed) area. Be careful 
not to disturb the stream bottom when you collect the water sample. If you get sediment from 
bottom disturbances, dump out the sample, move upstream (away from the disturbed area) 
and try again. For the observer, consistency is the key. If you initially wear your eyeglasses 
when you take the reading, then always wear your eyeglasses to take this measurement. 
However, you should never wear sunglasses when you take this reading. 

Before going out to your stream site to monitor transparency (or any parameter), please 
remember to fill out the top portion of the monitoring datasheet with 

your name (s)

, the 

station name

, and the

 station ID #

, as well as the 

date and time of the monitoring event

.  

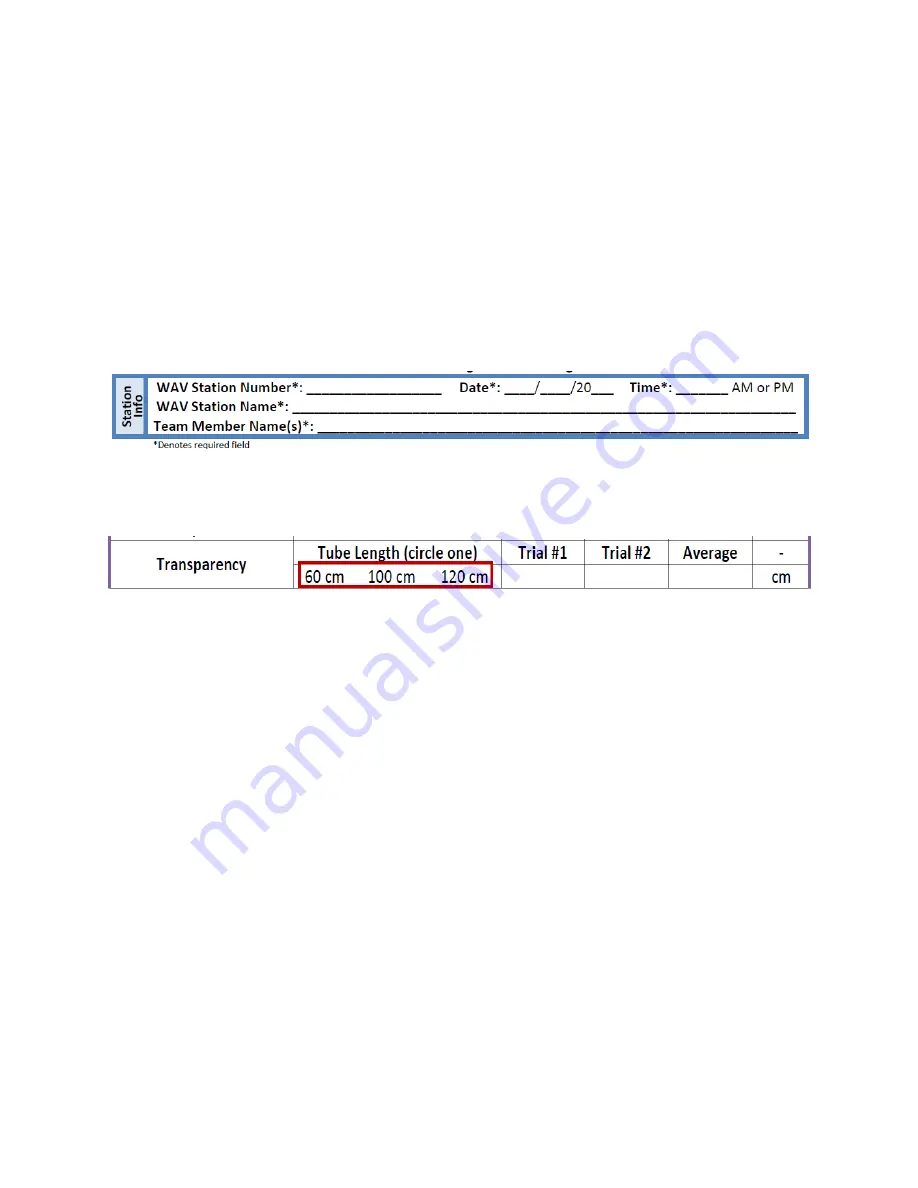
It is also important that the 

length of the transparency tube

 is recorded on the monitoring 

datasheet for each monitoring event as this information will be used when the data is 
evaluated as part of the quality assurance process. 

In Stream 

1. Make sure that the clamp on the drain tube is closed
2. Walk into the water at an access point downstream from the sampling location.

a. Be careful not to stir up the bottom sediment upstream of your sampling

location.

3. Face upstream (into the current) in the middle of the stream or in a well-mixed area off-

shore.

4. Collect your water sample by plunging your bucket or transparency tube 8-12 inches

beneath the surface or halfway down from the surface.

a. If using a bucket, scoop away from your body and into the current.

5. Cover the top of the transparency tube after you have filled it with water and return to

shore to take the reading.

From Shore 

To collect a sample while standing on the shore, use a bucket or sample bottle attached to a 
pole so that you can reach the water from your on shore location. Scoop from below the 
surface in the upstream direction and be careful not to stir up the sediment upstream of your 
sample. Pour the water into the transparency tube in order to take the transparency 
measurement. Collect additional samples if more water is needed to fill the transparency tube 
all the way to the top. 

Summary of Contents for 550A

Page 1: ...wer button powers the unit on or off Backlight button turns the display backlight on or off The light will turn off automatically after two minutes of non use Mode button allows the user to select between and mg L during calibration process When monitoring pushing Mode switches the instrument display between DO DO mg L and salinity calibration Arrow keys increases or decreases the value during cal...

Page 2: ...m the calibration storage chamber and doing the following Check that the sponge is damp rewet if necessary Shake or blow off excess water on the sensor Check for holes or tears in the membrane Check for air bubbles beneath the membrane 3 Reinsert the sensor into the calibration storage chamber at the back of the meter 4 On the calibration log record the date time name of analyst who is calibrating...

Page 3: ...1200 ft 10 Adjust the altitude with the up and down arrow buttons for the elevation where the calibration is taking place and press ENTER The saturation value is now showing on the meter display 11 Allow the saturation value red box to stabilize on the screen This may take a minute or two to happen 12 Press ENTER orange box The salinity of the water samples is now on the screen 13 Press ENTER agai...

Page 4: ...it this step is important to insure a stabilized temperature and walk away for 5 minutes Upon returning the DO percent saturation value should be within a couple of percent of the calibrated percent saturation value you recorded If it has drifted more than a couple of percent you must remove the cap membrane to check the condition of the probe If necessary refurbish the probe tip according to your...

Page 5: ... 4 11 0 11 0 11 1 11 1 11 2 11 2 11 3 11 3 11 3 11 4 11 4 11 5 11 5 11 5 11 6 11 6 11 7 11 7 11 8 11 8 11 84 11 9 9 48 2 10 7 10 8 10 8 10 9 10 9 10 9 11 0 11 0 11 1 11 1 11 2 11 2 11 2 11 3 11 3 11 4 11 4 11 4 11 5 11 5 11 56 11 6 10 50 0 10 5 10 5 10 6 10 6 10 7 10 7 10 7 10 8 10 8 10 8 10 9 10 9 11 0 11 0 11 0 11 1 11 1 11 2 11 2 11 2 11 29 11 4 11 51 8 10 3 10 3 10 3 10 4 10 4 10 4 10 5 10 5 1...

Page 6: ...29 84 2 7 1 7 2 7 2 7 2 7 3 7 3 7 3 7 3 7 4 7 4 7 4 7 4 7 5 7 5 7 5 7 6 7 6 7 6 7 6 7 7 7 69 7 7 30 86 0 7 0 7 1 7 1 7 1 7 1 7 2 7 2 7 2 7 2 7 3 7 3 7 3 7 3 7 4 7 4 7 4 7 5 7 5 7 5 7 5 7 56 7 6 31 87 8 6 9 6 9 7 0 7 0 7 0 7 0 7 1 7 1 7 1 7 1 7 2 7 2 7 2 7 2 7 3 7 3 7 3 7 3 7 4 7 4 7 43 7 5 32 89 6 6 8 6 8 6 8 6 9 6 9 6 9 6 9 7 0 7 0 7 0 7 0 7 1 7 1 7 1 7 1 7 2 7 2 7 2 7 3 7 3 7 30 7 4 33 91 4 6 7 ...

Page 7: ...e a You can also monitor dissolved oxygen from a bridge overpass as to not disturb the bottom sediment 2 Remove the probe from its chamber and insert it into the water to be measured a Continuously stir or move the probe through the water especially when monitoring in very still water while taking the measurement 3 Allow the temperature and dissolved oxygen readings to stabilize a This should take...

Page 8: ... return to measurement mode upon completion of the first calibration point This means that you will complete two one point calibrations as you have to re enter calibration mode in order to complete the pH 10 calibration The software update on the newer meters keeps the meter in calibration mode throughout the calibration process the values on the screen will continue to blink This means that you w...

Page 9: ...f you notice your meter is not calibrating properly try cleaning the probe by following the instructions in the instrument s manual located in the pocket of your meter case or contact the WAV coordinator for directions Before calibrating your meter at the beginning of the field season please fill out the top portion of the calibration log with the following information Your name as well as that of...

Page 10: ...again to return to the pH screen on the meter 8 Press the CAL button on the meter in order to start the calibration process blinking 9 Place the electrode and temperature sensors into the pH buffer solution and submerge the glass bulb completely in the solution 10 Wait for the reading to stabilize and record the Stabilized pH value on the calibration log 11 Press the ENTER key once and record the ...

Page 11: ...f of the electrode 6 Click the MODE button to find the temperature reading and record value on the calibration log 7 Click the MODE button again to return to the pH screen on the meter 8 Press the CAL button on the meter in order to start the calibration process 9 Place the electrode and temperature sensors into the pH 7 buffer solution and submerge the glass bulb completely in the solution 10 Wai...

Page 12: ...top blinking as the meter should have exited calibration mode and entered measurement mode 19 Remove the electrode from the pH 10 buffer solution rinse with distilled water and shake off the excess water from the electrode 20 Replace the pH probe in the electrode soaker bottle refill if necessary turn the meter off and head out to the field to complete your monitoring activities Cal procedure pH 5...

Page 13: ...to the middle of the stream from a safe access location a Walk upstream from the access point downstream of monitoring location as to not disturb the bottom substrate 5 Place pH and temperature probes into the stream and gently stir the probes 6 Wait 2 3 minutes for pH reading to stabilize 7 Record the pH reading on the monitoring datasheet 8 Rinse the electrode with distilled water and shake off ...

Page 14: ...on will be used when the data is evaluated as part of the quality assurance process In Stream 1 Make sure that the clamp on the drain tube is closed 2 Walk into the water at an access point downstream from the sampling location a Be careful not to stir up the bottom sediment upstream of your sampling location 3 Face upstream into the current in the middle of the stream or in a well mixed area off ...

Page 15: ...disc is not visible have your partner let water out a little at a time using the valve at the bottom until disc is just visible a Have them stop letting water out immediately when you can just see the contrast between black and white on the disc at the bottom of the tube 6 Read the level of water in the tube using the measuring tape on the side of the tube a Measurement will be in centimeters 7 Re...

Page 16: ...er should be Microsoft Internet Explorer version 5 5 or higher 1 Use Internet Explorer and navigate to https dnrx wisconsin gov swims 2 Enter your WAMS User ID and Password and click Sign In 3 Click the Submit Data tab along the menu bar at the top of the screen 4 Click the Add New button on the left side of the screen ...

Page 17: ...IMS account assigned to the correct station s 6 Select your group of Data Collectors single individual or multiple people using the down arrow to the right of the name field If the correct list of data collectors is not in the list create a new group by following the instructions below a If necessary Create a new data collector group This step is only necessary once for each group of collectors Af...

Page 18: ...CULARS TO SELECT A STATION THAT DOES NOT MATCH THE PROJECT FIELD i Report missing or incorrect station information to the WAV Data Manager and wait until the correct project and station information are available before entering your monitoring data 8 Click the Show Map button to confirm the location of your monitoring site Notify the data manager if the location is incorrect 9 Enter the Start Date...

Page 19: ... contact the program coordinator to correct this before you will be able to enter your monitoring data 12 DO NOT ENTER the Latitude and Longitude a The location of your monitoring site is already established in SWIMS If you wish to check the location of your monitoring site click the Show Map button as described in Step 8 13 Enter the End Date and Time for when you completed your monitoring work a...

Page 20: ...er the values recorded for each measured parameter If you did not monitor the parameter LEAVE IT BLANK Entering a 0 into SWIMS does not indicate that you did not monitor it it indicates that you got a result of 0 b Use the dropdown menus when available to record your response 17 Click Save to save data a You will now see the result for the transparency average grey line 18 To continue entering you...

Page 21: ...i If you did not monitor for road salt leave the ECTestr line blank 20 If you entered streamflow data click Save to save the data a You will now see the calculated results for streamflow grey lines b If not skip this step and continue to Step 21 21 To continue entering your monitoring results a Click Next Date and Next Station to return to the initial Create Monitoring Data screen to begin enterin...

Page 22: ...r PM using the dropdown menu to the right i If you are doing the monthly check LEAVE THOSE BLANK 23 To continue entering your monitoring results a Click Next Date and Next Station to return to the initial Create Monitoring Data screen to begin entering data for a different station or for a different date b Click Save to save data c Click Save and Return to List to view your recently updated monito...

Page 23: ...r streams 10m wide separate data sheet a Enter the values recorded for each measured parameter If you did not monitor the parameter LEAVE IT BLANK b Use the dropdown menus when available to record your response 28 If you entered habitat data for streams 10m wide click Save to save the data a You will now see the results for the calculated fields grey lines b If not skip this step and continue to S...

Page 24: ...station or for a different date b Click Save and Return to List to view your recently updated monitoring data c Click Save and Next to move to the next data entry screen 33 Congratulations You re done entering data for this monitoring event Viewing or Editing your Monitoring Data in SWIMS NOTE Your web browser should be Microsoft Internet Explorer version 5 5 or higher 1 Use Internet Explorer and ...

Page 25: ...time or end date time comments click Save and Return to save your changes and view other fieldwork event 8 To edit previously entered monitoring data streamflow weather biotic index etc you will need to select the correct data entry form before moving to the next screen When you enter the data initially all of the forms are linked but when editing they are separated so you have to select them one ...

Page 26: ...V_Thermistors blue box on the back page of the monitoring datasheet Step 22 9 Click Next to edit the results on the next screen a Clicking Save will save your changes but the screen will not change 10 Once you have made the necessary changes to the data form click Save and Return to view your recently updated monitoring data Please contact the WAV program coordinator if you have any questions or c...

Reviews: