8
© 2020 Virginia Diodes, Inc.
—All Rights Reserved—Rev: 12 June 2020
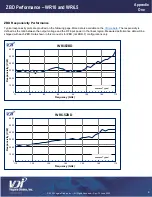
ZBD Responsivity Performance
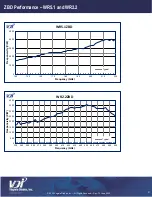
Typical responsivity plots are provided on the following page. More data is available on the
. The responsivity is
defined as the ratio between the output voltage and the RF input power in the linear region. Measured performance data will be
shipped with each ZBD. Data shown in this manual is for ZBD (not ZBD-F) configurations only.
ZBD Performance
–
WR10 and WR6.5
Appendix
One
0
1000
2000
3000
4000
5000
6000
75
80
85
90
95
100
105
110
Respo
n
siv
it
y
(
V
/W
)
Frequency (GHz)
WR10ZBD
Typical
0
1000
2000
3000
4000
5000
6000
110
120
130
140
150
160
170
Respo
n
siv
it
y
(
V
/W
)
Frequency (GHz)
WR6.5ZBD
Typical


