background image

[email protected]  •  21

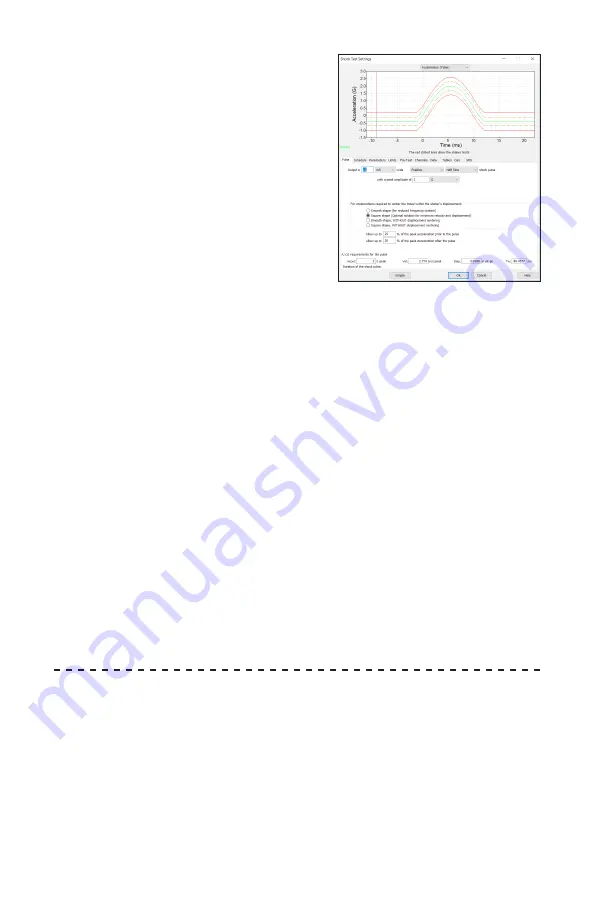
PULSE

The desired pulse width, shape, and 

amplitude for the test are entered here. 

Also, the allowable pre-pulse and post-

pulse acceleration levels are entered 

here as a percentage of the pulse peak 

acceleration level.

SCHEDULE

The duration of the test, in number of 

pulses, is entered here. The schedule 

also may be used to enter levels scaled to 

different amplitudes.

PARAMETERS

The parameters that control the behavior of the control loop are entered 

here. The parameters generally may be left at the default settings. Refer to 

the 

How to tune Shock I/O unit parameters

 section in the Help File for 

more information on how to fine-tune these parameters for your system.

LIMITS

The tolerance and abort limits for the test, set as a percentage of the peak 

output and measured relative to the demand time waveform, are entered here. 

The tolerance lines are reference lines shown on the graphs (brown dashed 

lines) and are used to determine when to switch to 

Run

 mode when starting a 

test. The Plus and Minus aborts are limits that, when exceeded, cause the test 

to abort. The limits on the allowable drive voltage are also entered here.

CHANNELS

Select which channel or channels you want to use as the control signal 

here. When selecting multiple channels, the time waveforms of the selected 

channels are averaged together.

DATA

The directory or test data storage is selected here. Data can be automatically 

stored at a regular pulse interval, at the end of each level (levels are defined 

using the Schedule dialog box), and at the end of the test. All pulses that lie 

outside of the defined tolerance lines can also be stored.

At this point the test definition is complete. Select 

OK

 to close the dialog 

box. You will be asked if you want to save the test definition to the hard 

drive. Select 

Yes

; enter the desired name and click 

Save

 to save the test.

Additional Tips & Tricks for ShockVIEW

To limit shaker displacement, use the 

Square Shape

 setting on the Pulse tab. 

Also, be sure to check the 

Mil-STD pulse limits

 on the Limits tab if MIL-STD 

settings are required.

Summary of Contents for VibrationVIEW

Page 1: ...VibrationVIEW VIBRATION CONTROL QUICK START GUIDE ...

Page 2: ... the VibrationVIEW Software Manual For optimal system settings and troubleshooting and safety precautions please refer to the Hardware Manual packaged with your product or the digital Help file If you have questions regarding your system please contact your Vibration Research representative or our product support staff 1 616 669 3028 8am to 5pm Monday Friday EST support vibrationresearch com Vibra...

Page 3: ...ut Configuration 12 System Limits 12 System Check 13 SineVIEW Test Set up 15 RandomVIEW Test Set up 18 ShockVIEW Test Set up 20 FDRVIEW Test Set up 22 Multi Axis Test Set up 24 Automatic Report Generation 26 Troubleshooting Connection Errors 28 Tips Tricks 30 Important Changes to VibrationVIEW 23 Key Mapping 34 ...

Page 4: ...nect the ObserVR1000 network port to the dedicated network card on the computer using an Ethernet cable included 2 Connect the external battery charger to the ObserVR1000 for uninterrupted power 3 Connect the amplifier s input to the OUT connector on the rear panel of the ObserVR1000 4 Connect an accelerometer to channel 1 on the front panel Other accelerometers can be connected to channels 2 to 1...

Page 5: ...R1000 channels 1 16 to any port on the switch Connect the additional ObserVR1000 units to the sequential ports 2 Connect the PC to any available port with the Ethernet cable included 3 Connect the external battery chargers included to each ObserVR1000 unit for uninterrupted power 4 Connect the shaker amplifier s input to the OUT connector on the first ObserVR1000 5 Connect sensors to front analog ...

Page 6: ...cluded 2 Connect the power cord to the VR9500 The power input will automatically switch for voltage 90VAC to 250VAC and 50 60 Hertz 3 Connect the shaker amplifier s input to the Drive output connector on the rear panel of the VR9500 4 Connect an accelerometer to channel 1 on the front panel Other accelerometers can be connected to channels 2 3 and 4 5 Turn on the VR9500 Video Setting Up Your Syste...

Page 7: ...dditional VR9500 units to the sequential ports 2 Connect the PC to any available port with the Ethernet cable included 3 Connect the AC power cords included to the VR9500 units 4 Connect the shaker amplifier s input to the Drive output connector on the first VR9500 For systems controlling two shakers simultaneously connect the second shakers s amplifier input to the COLA output connector on the fi...

Page 8: ...t to the dedicated network card on the computer using an Ethernet cable included 2 Connect the power cord to the VR10500 The power input will automatically switch for voltage 90VAC to 250VAC and 50 60 Hertz 3 Connect the shaker amplifier s input to the Drive output connector on the rear panel of the VR10500 4 Connect an accelerometer to channel 1 on the front panel Other accelerometers can be conn...

Page 9: ...rd on the computer using an Ethernet cable included Up to two additional VR10500 units can be connected to the expansion network port s 2 Connect the AC power cords included to the VR10500 units 3 Connect the shaker amplifier s input to 1 Drive output connector on the first VR10500 For systems controlling multiple shakers simultaneously connect the additional shaker s amplifier inputs to the remai...

Page 10: ...Connect the additional VR10500 units to any available port 2 Connect the PC to any available port with the Ethernet cable included 3 Connect the AC power cords included to the VR10500 units 4 Connect the shaker amplifier s input to 1 Drive output connector on the first VR10500 For systems controlling multiple shakers simultaneously connect the additional shaker s amplifier inputs to the remaining ...

Page 11: ...uring the I O Unit 1 To set up the dedicated network card for VibrationVIEW first right click the Start Button Network Connections 2 Choose option Change adapter options 3 Right Click on the network card attached to the I O unit and select Properties continued on next page ...

Page 12: ...ssign IP address 192 168 3 10 and subnet mask 255 255 255 0 If multiple network cards are installed in the computer the IP address can be adjusted Other recommended values are 192 168 2 10 and 192 168 4 10 although any Class C or Class D subnet will work Click the OK button to return to the previous dialog box 6 From the Properties dialog box click the Sharing tab Make sure Internet Connection Sha...

Page 13: ...iously configured Typically this will be 192 168 3 10 Select Probe Click the Apply button 3 Your I O unit serial number will be added to the drop down menu for channels 1 4 when it initially connects to the computer Select the appropriate I O unit serial number to configure channels 1 4 and optionally channels 5 8 channels 9 12 and 13 through 128 in blocks of 4 channels The I O unit control boxes a...

Page 14: ...lectronic Data Sheet containing the calibration information simply click the TEDS checkbox and the information will automatically be entered when you click Read All TEDS When the appropriate values are entered click the OK button The new accelerometer sensitivity factors will take effect immediately Note Be sure to check the Accel Power box if you want the I O unit to provide the constant current ...

Page 15: ...eration for your system using Newton s law Force mass acceleration Once all specifications are entered be sure to click Apply choose yes to reset the system System Check Verify Inputs and Outputs Perform the following procedure to verify that the input and output levels and frequencies are correct 1 Select Test Test Type System Check to check menu command to switch the system into System Check mod...

Page 16: ... oscilloscope or true RMS voltmeter set the output voltage level to 0 5 volts 0 to peak and verify that you have a 0 5 volt 0 to peak amplitude reading 0 35 volts RMS If the Drive output connector is not measuring 0 35 volts RMS your system may require calibration TIPS If the shaker vibrates but the input waveform remains flat click the Start button a second time so that the text on the Start butt...

Page 17: ... next set of information for setting up the test shaker vibrating with 0 1 displacement shaker still 6 Once you get both an output and an input signal use a displacement measurement tool Example A to verify that the shaker peak to peak displacement matches the value shown in the System Check Control Center If it does not match select the Configuration Inputs menu command to verify that the acceler...

Page 18: ...mplitude levels and to select one or more fixed frequency tones SWEEP The sweep rate is entered here Enter the sweep rate and click the drop box to select the desired units PARAMETERS The feedback control parameters for the test are entered here For most tests the parameters may be left at their default values In some cases such as when the control accelerometer sees a large resonance these values...

Page 19: ...formation on how to determine the appropriate Max Output and Max System Gain parameters for your test CHANNELS The control channels for the test are selected here They can be combined using one of four methods A tracking filter can be selected for any channel DATA STORAGE The directory into which the data from this test will be stored is selected here Data can be automatically stored on a regular ...

Page 20: ...min sweep Logarithmic to see how long one sweep will take RandomVIEW Test Setup Entering a Random Test Select Test Define New Test Random Test Simple Test Mode is enabled by default To disable Simple Test mode select the Configuration Parameters menu option and uncheck Define new tests as Quick Tests Select Apply OK Close Random test and reopen for change to take effect This section will guide you...

Page 21: ... shown on the graphs brown dashed lines and are used to determine when to switch to Run mode when starting a test When the number of lines outside the abort limits exceeds the Max Outlier the test will be aborted The abort lines are shown on the graphs as solid red lines The Max System Gain and Output Threshold parameters are safety limits that depend on your particular shaker and amplifier Refer ...

Page 22: ...eakpoint table into the Table tab of RandomVIEW This can be done by highlighting the frequencies and amplitudes of the breakpoint in the Excel file and right click and select copy Then open the table tab in VibrationVIEW and right click and select Paste Table from clipboard The frequencies and amplitudes are then populated in the software automatically ShockVIEW Test Setup Entering a Shock Test Se...

Page 23: ... and are used to determine when to switch to Run mode when starting a test The Plus and Minus aborts are limits that when exceeded cause the test to abort The limits on the allowable drive voltage are also entered here CHANNELS Select which channel or channels you want to use as the control signal here When selecting multiple channels the time waveforms of the selected channels are averaged togeth...

Page 24: ...etting up the test PLAYBACK The name of the playback file the record level and the sample rate for that file are entered here There are also buttons for exporting and importing waveform data For details on importing and exporting waveform data refer to the How to import and export Field Data Replicator waveforms section in the Help File SCHEDULE The time duration of the test is entered here The te...

Page 25: ...els are defined using the Schedule dialog box and at the end of the test Select the check boxes for your desired data storage times and enter the desired interval times RECORD The playback file can be optionally recorded at this time The record option is accessible by pressing the Record Playback File pushbutton on the Playback tab Enter the desired sample rate in the sample rate dialog select the...

Page 26: ... than one I O unit control box In the Configuration Hardware tab assign the appropriate I O unit s to channels 1 4 and channels 5 8 also channels 9 12 if 3 axis testing is desired Select Apply In the Configuration Outputs tab set up the loop labels By default they are Loop 1 and Loop 2 but they can be named anything i e x axis y axis ...

Page 27: ...xes Make the appropriate changes to control if desired 4 In the Schedule tab enter how long the test is to run 5 If the recordings are of different lengths the shorter ones will repeat more often Random Multi Axis Tests 1 Open Random test 2 Enter the Breakpoint Table for Loop 1 and Loop 2 in the Table tab 3 In the Schedule tab enter how long the test is to run 4 In the Channel tab Loop 1 will have...

Page 28: ...ories of the directory c VibrationVIEW Templates Sine templates are stored in the Sine subdirectory Random templates in the Random subdirectory etc To create custom reports new templates can be created using a RTF editor file and stored in the appropriate directory One suitable RTF file editor is WordPad a default program in Windows that is usually installed under Start Programs Accessories WordPa...

Page 29: ...n be automatically inserted into the test report With a form the data entry can occur during test setup and the appropriate report will run at the end of the test A form formatted as an HTML file is a section of a document containing normal content markup special elements called controls checkboxes radio buttons menus etc and labels on those controls Users generally complete a form by modifying it...

Page 30: ...he network switch should show a link light A green light should be visible through the peep hole next to the Network Connector of the I O unit The box must be powered The Ethernet card in the computer is not functioning properly Problem 2 The VR I O box is not returning the connection request from VibrationVIEW Windows firewall may be blocking communication Other security software may be blocking ...

Page 31: ...p the system Open the Help file and navigate to How To section Contact Vibration Research Before contacting VR please Enable network logging in Configuration Hardware and try to reconnect After re connection fails click the View log and send a text file to support vibrationresearch com ...

Page 32: ...ick and hold a channel of preference drag out of graph window do not release return to window and release Zooming the graph Right click hold and drag the mouse to draw a zoom window Release the mouse button to view To zoom back out double click the right mouse button To view test detail information Edit Graph Insert Graph Text Window For example if you want to show the serial number of the 9500 un...

Page 33: ...st profiles select Test Recent Test Profiles or right click the Open Test icon for a list of the last 15 tests To quickly find the data for recently run tests select Help Help with Recent Test or File Recent Data Files or right click on the Open Data icon When entering time values on the Schedule tab you can use shorthand 10 hours 10h 5 minutes 5m or combinations 1h30m To restore a profile from a ...

Page 34: ...a computer it must have been connected to an 9500 hardware box at least once Quick Reports provides for easy report generation for any test Simply right click on Report Setup Quick Report and select the information to be displayed in a report Once this is done click on the report button to generate the report automatically Cursors Hold down the Shift key while moving cursor to snap to the nearest ...

Page 35: ... videos on our website or follow the QR code http vibrationresearch com resource archives videos filter Archived Webinar Videos View archived webinars on our website or folllow the QR code You will need to create a login to view http vibrationresearch com webinar archive Important Changes to VibrationVIEW Visit our Website Go to vibrationresearch com upgrades support agreement to see important cha...

Page 36: ... selected annotation F8 Start Test Sequence F9 Run Test F10 Stop Test F11 Advance immediately to next level F12 Print the screen image to the printer Shift Insert Add annotation at nearest peak Ctrl Insert Add annotation at nearest valley Insert Add an annotation to the graph View next data file in directory View previous data file in directory Alt PrtSc Copy the screen image to the clipboard to b...

Page 37: ... Zoom out to fit the data G Change the selected graph settings I Change the input configuration M Save the current output to Memorized Drive N Create a new graph O Open a stored data file P Freeze Unfreeze the graph updates Q Autoscale all open graphs R Generate a report S Save the data to a file T Inserts Time Date stamp in Test Notes V Paste text from the clipboard W Identify the primary I O uni...

Page 38: ... Key Mapping Sine Random Shock FDR Test is stopped Test is running Starting test Holding frequency with phase tracking of the resonance Starting test using Memorized Drive Holding fixed frequency Test paused Waiting for operator action ...

Page 39: ...support vibrationresearch com 37 ...

Page 40: ... 1 616 669 3028 VibrationResearch com support VibrationResearch com 2021 Vibration Research Corporation is a registered trademark in the United States and other countries 032021 ...

Reviews: