5
3. Follow the instructions in the dialog box to complete the calibration, and then
click
.
Collect Data with Logger
Pro
Measurement
vs.
Wavelength (Generate a Spectrum)
1. Fill a cuvette about 3/4 full of a sample of the solution to be tested. Place the
sample in the Spectrophotometer and click
. Click
to end data
collection.
2. To store the spectrum data, choose Store Latest Run from the Experiment
menu.
Measurement
vs.
Concentration (Beer’s Law Studies)
1. Generate a spectrum as described above.
2. Click the Configure Spectrophotometer Data Collection button,
.
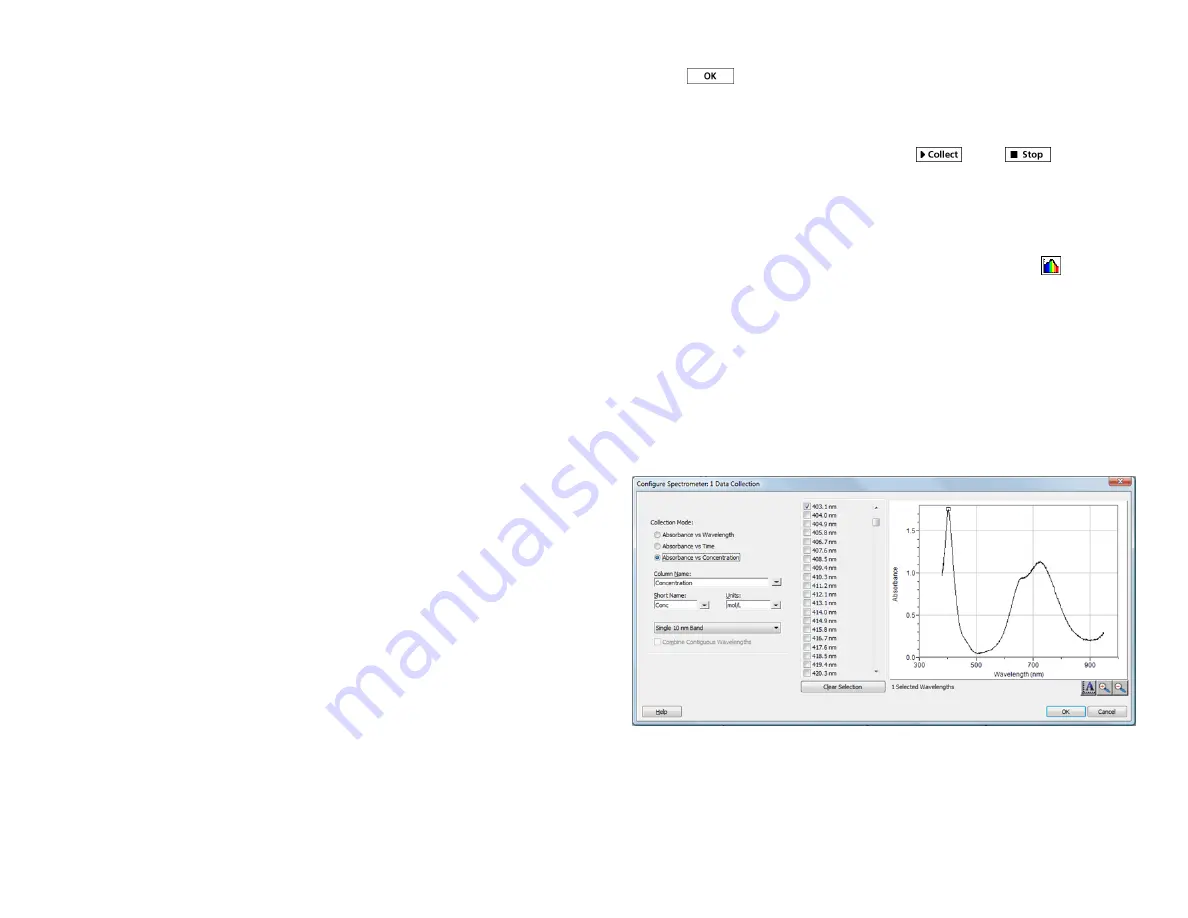
There are three regions in this box:
l
Collection Mode
The three options for data collection are offered. If the
measurement (Absorbance in this example)
vs.
Time or
vs.
Concentration is
selected, a wavelength or wavelengths will need to be chosen.
l
Graph
The graph displays a full-spectrum analysis of the sample in the
cuvette holder. By default, the wavelength with the maximum measured value
will be selected. You may wish to choose a different wavelength by tapping on
the graph or selecting wavelength(s) from the list.
l
List of wavelength options
This column lists all the available wavelengths. It
becomes active when either the Concentration or Time mode is selected.
Configure Spectrometer data-collection dialog box
3. Select Absorbance (or %T)
vs.
Concentration as the data-collection mode. The
wavelength with the maximum value from the spectrum (λ max) will be
automatically selected. There are three options when choosing a wavelength
(or wavelengths) for subsequent measurements.
To increase the sample time, or if data collection is unusually slow, choose Set Up
Sensors ► Spectrophotometer: 1 from the Experiment menu. Set the Sample Time
(begin with 75 ms, with subsequent reductions by 20 ms) to a suitable value and
decrease the Samples to Average to 1.
Change the Settings in LabQuest
The Data Collection Screen in LabQuest lists all the settings for the device. To
display this box choose Sensors ► Data Collection from the Meter screen.
For most experiments, the default settings work well.
There are five parameters listed in the dialog box.
l
Sample Time: This is similar to the shutter speed of a camera. LabQuest
automatically selects the proper sample time during calibration.
Note:
For
emission studies, you may need to change the sample time manually.
l
Wavelength Smoothing: This is the number of adjacent readings on either side
of a given value that is used to calculate an average value.
Note:
Be careful
adjusting this parameter as it may shift your wavelength values slightly.
l
Samples to Average: This is the number of readings taken at a given
wavelength to calculate an average reading.
l
Wavelength Range: The range is determined by the type of Spectrophotometer
in use.
l
LED Intensity: This allows you to change the intensity of the excitation LED.
This setting is only available in fluorescence mode by tapping on the meter.
Using the Product with Logger
Pro
Consider using Spectral Analysis, the free app dedicated to spectroscopy. To
proceed with Logger
Pro
, connect the sensor following the steps in the Getting
Started section of this user manual.
Select the Type of Data (or Units) You Want to Measure
There are three general types of data collection that measure absorbance or
transmittance—absorbance (or %T)
vs.
wavelength, which produces a spectrum,
absorbance (or %T)
vs.
concentration for Beer’s law experiments, and absorbance
(or %T)
vs.
time for kinetics experiments.
The default data type is absorbance. If you want to measure the absorbance of a
solution, proceed directly to the Calibrate section below.
If you want to measure %T, fluorescence, or intensity, do the following:
1. Choose Change Units ► Spectrophotometer from the Experiment menu.
2. Select the unit or data type you wish to measure.
Calibrate (Optional if Measuring Fluorescence or Intensity)
1. To calibrate the Spectrophotometer, choose Calibrate ► Spectrophotometer
from the Experiment menu.
Note:
For best results, allow the
Spectrophotometer to warm up for a minimum of ten minutes.
2. Fill a cuvette about 3/4 full with distilled water (or the solvent being used in
the experiment) to serve as the blank. After the Spectrophotometer has warmed
up, place the blank cuvette in the Spectrophotometer.


