


V-Sense
TM
Profile X1
©
User Guide
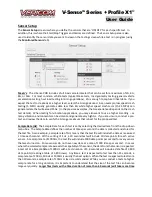
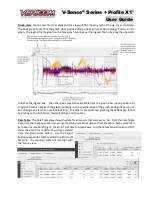
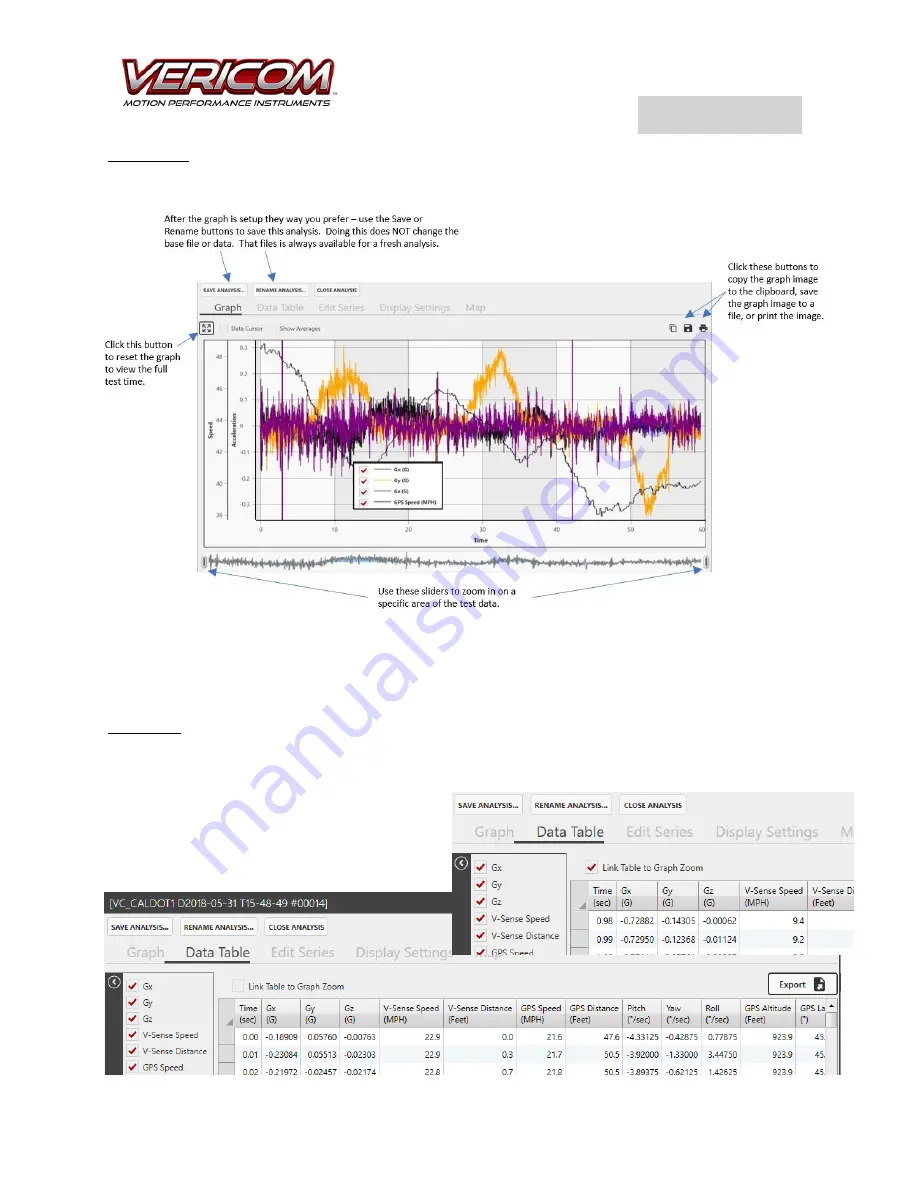
Graph View
: Open a test file for analysis and the view will first show a graph of the Gx, Gy, and Gz data.
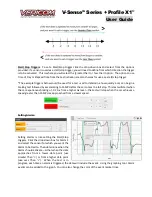
The basic graph tools from the graph view include adding a Data Cursor and/or Average Cursors to the
graph. The legend for the graph can be moved by hovering over the legend, then click-drag the upper left
corner of the legend box. The other basic capabilities available from the graph view include options to
copy/print/save an image of the graph, zooming in on a specific range of the graph, saving the version of
an edited graph view as a new ‘Analysis File.’ The other more advanced graphing capabilities are found
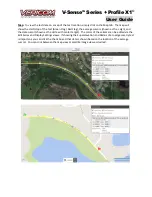
by clicking on the Edit Series, Display Settings, and Map tabs.
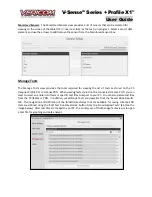
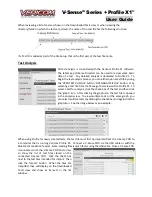
Data Table
: The Data Table view shows
the data for all sensors that were set as ‘On
.
’
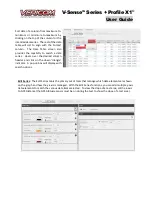
From the Data Table
view, click the check box next to any sensor to add/remove that data set from the table. Each column can
be resized or moved left/right. Click the ‘Link Table to Graph Zoom’ and the data table will resize to ONLY
show the data that is within the range selected
from the graph zoom sliders. Use the Export
button to export the table as edited to a Microsoft
Excel file. The exported table will also align with
the
‘zoom’ view.
You can also sort the data or search for a specific
data range by clicking on the column headers.