V-Sense
TM
Profile X1
©
User Guide
Display Settings
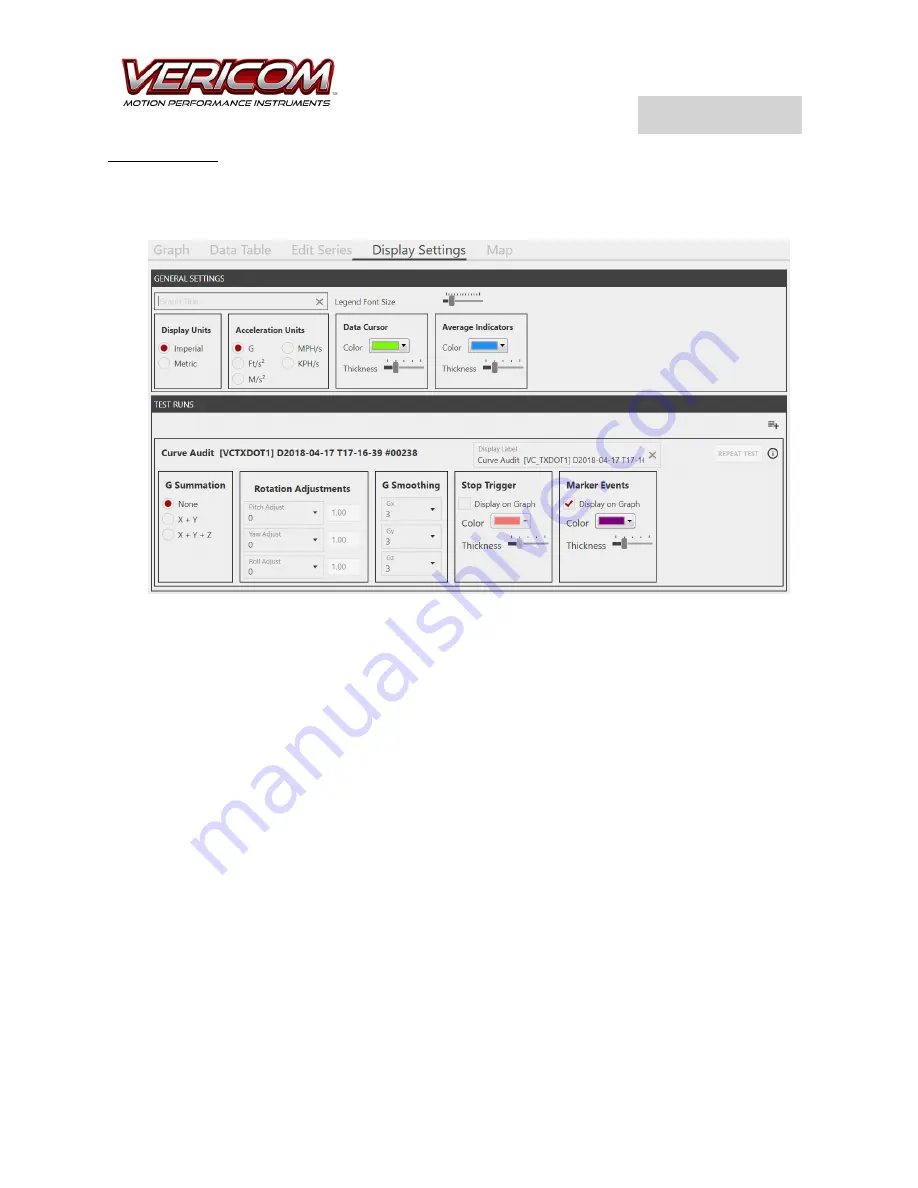
: The Display Settings view provides tools to edit the basics of data displayed on the
graph. The ability to change the units between Imperial/Metric, adjust the acceleration units from Gs to
distance/time, as well as adding a Title and editing the font size of the graph legend. Explore the options
and tools provided from the Display Settings view to adjust how the graph data is displayed.
G Summation
: The G Summation options allow you to display the individual acceleration axis data or
combined X+Y or X+Y+Z.
Rotation Adjustments
: The Rotation Adjustments provide the option to compensate acceleration data
based on the amount of rotation. Typically, rotational adjustments are used when the test object
rotates significantly while accelerating. As an example, a larger truck or bus will often have significant
forward pitch rotation when testing for braking/stopping capability. Using the Rotation Adjustment
options, the Gx, Gy, or Gz data can be smoothed and reduces to account for the effect rotation has on
acceleration data.
G Smoothing
: The Smoothing setting will reduce noise data from your data set and graph. Select the
preferred Smoothing parameter desires for the test. Typically, a Smoothing setting of 3 is appropriate
for low vibration tests and tests that have a sample rate of 100Hz or less. With higher vibration testing
events or testing that uses a sample rate of 1000 or more, you may elect to smooth the noise in the data
by selected a higher G Smoothing. The settings allow for a smoothing of 1 (no smoothing) to 9
(maximum smoothing). To understand how the setting affects the data and graph, experiment with a
graph and G Smoothing.


