background image

Frequency & Frequency Fine 

Adjustment of TFT monitors 

The Video signal is made up of pixels.  These are generated in the video generator (process          
controller, PC, etc.)  A crystal oscillator controls the rate at which the pixels are generated:  this is 
called the Dot Clock. 
 
When the TFT monitor receives the video signal it must convert it back to it’s individual pixels in digital 
form.  To do this it must sample the video at the same rate as the dot clock. 
When the 

frequency

 control is adjusted the monitor is changing the rate at which the video is sampled.  

Each press of the 

frequency 

control changes the sample rate by one pixel per line. 

The visual effect on the monitor screen of incorrect 

frequency 

adjustment is that there are vertical 

bands of darkened or noisy pixels running down the screen.  The greater the 

frequency

  error, then 

the more bands there are.  If the 

frequency

 value is wrong by two pixels, then two noisy bands will be 

seen.  If the value is wrong by 100 pixels then 100 noisy bands will be seen.  Strangely, a picture that 
has the 

frequency

 wrong by a very large amount can actually appear better than the one where the 

frequency is only slightly wrong. 
 
The actual content of the picture also has a big effect on how easy it is to see the noise bands.  To set 
the frequency easily, it is best to display a picture that has a large number of individual pixels          
displayed—a screen of “

░░░░

“ will be very good for helping to make the adjustment, while “

████

 “ 

or “       “ will completely hide the noise bars.  In the practice it is not always  possible to control the 
characters like this so adjustment has to be made with pages of text etc. 

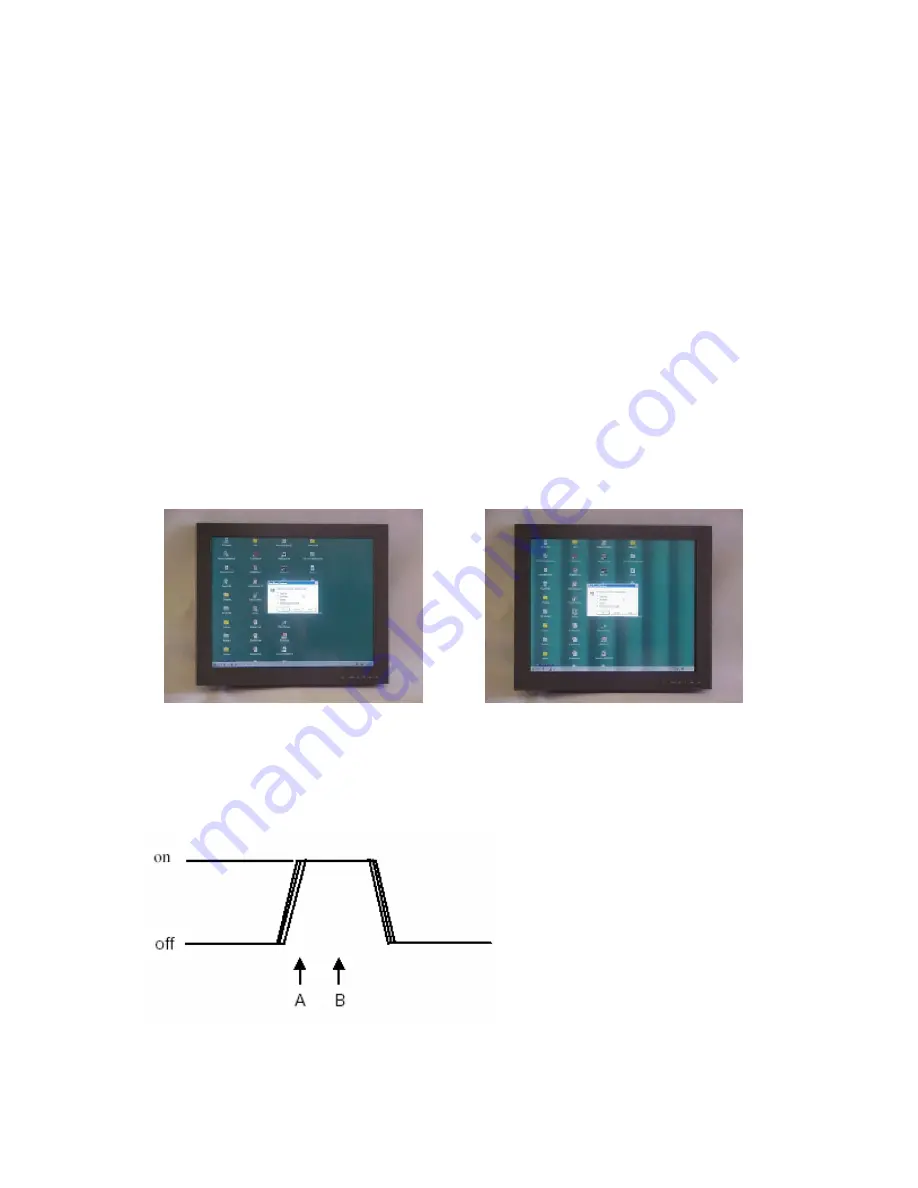
A Windows Shutdown screen contains a  large amount of the “

░░░░

“ type of video so it is very 

good for seeing the effect of the frequency setting.  Picture 1 shows the shutdown screen with 
frequency correctly set. 
Picture 2 picture had six vertical dark bands due to incorrect frequency. 

Figure 1:  Correct Frequency 

Picture 2:  Incorrect Frequency 

This figure shows what a single bright pixel 
looks like in the video signal.  The pixel does 
not have vertical sides and the exact start 
time of the pixel is uncertain.  If the monitor 
samples the pixel at “B”, then “A” then the 
uncertainty of the pixels start time and the 
slope of he pixel edge will combine to make 
the pixel appear noisy and dark on the 
screen. 

It is the 

frequency fine 

control that lets the monitor be adjusted so that the sample is taken at B instead of A. 

3.5


Summary of Contents for VT181R2

Page 1: ...VT181R2 VT181RH2 VT181M2 User s Guide Read these instructions completely before attempting to operate your new Color Display VarTechSystems Inc Solutions for Demanding Applications Industrial CRT and...

Page 2: ...3 Mechanical Drawings 12 2 2 Repacking 3 18 1 Low Scan Tabletop Mechanical 13 2 3 Signal Connections 4 18 1 Low Scan Rack Mount Mechanical 14 18 1 Honeywell Configured Rack Mount Mechanical 15 Section...

Page 3: ...t the LCD can display Recently the video card has taken on a new role It is the responsibility of this device to scale a particular video resolution to the native resolution of the LCD Simply consider...

Page 4: ...wer supply from the wall before moving Do not expose the display to direct sunlight or heat Do not use this display near water Do not place any heavy objects on the power cords Damage may cause electr...

Page 5: ...not rub or strike the Active Matrix LCD with anything hard as this may scratch mar or damage the Active Matrix LCD permanently Do not press the LCD screen with your finger for a long time as this may...

Page 6: ...d 10 Sync ground SIGNAL INPUT Standard hi density 15way video connection 11 Not connected 12 Not connected 13 Horizontal sync 14 Vertical sync 15 Not Connected TTL Input This 9 way D connector allows...

Page 7: ...he display backlights These basic user controls are the only adjustemnts that can be made when the OSD lockout function is enabled Advanced OSD Controls Pressing menu button activates the monitor s ma...

Page 8: ...the buttons to adjust to make the display characters appear as bright sharp and noise free as possible Step 4 Adjust the Vertical Size The monitor must make many calculations when this control is use...

Page 9: ...video picture A PLEASE WAIT banner will be shown during this set up period The values decided upon are based on the assumption that the video aspect ration is 4 3 This can be changed as described abo...

Page 10: ...he one where the frequency is only slightly wrong The actual content of the picture also has a big effect on how easy it is to see the noise bands To set the frequency easily it is best to display a p...

Page 11: ...ell TDC3000 EPDG2 560 x 275 50Hz 15 63kHz Confidential 640 x 200 60Hz 15 7kHz CGA 640 x 350 60Hz 21 83kHz EGA 714 x 288 50Hz 15 625kHz CCIR 508 x 338 50Hz 17 85kHz Aydin 5215 see note 2 508 x 240 60Hz...

Page 12: ...play Tip Two If there are any specifications for the system then you may be able to calculate what the approximate value of frequency should be The frequency value to set on the monitor is the TOTAL n...

Page 13: ...nd certain chemical cleaners can easily damage the surface Never use alcoholic or ammoniac cleaners to clean the polycarbonate shield or a touch screen Replacing a Line Cord To avoid shock and fire ha...

Page 14: ...IONS 6 Section Mechanical Drawings Model Description Page s VT181M2 18 1 Low Scan Tabletop Mechanical Drawing 13 VT181R2 18 1 Low Scan Rack Mount Mechanical Drawing 14 VT181RH2 18 1 Honeywell Configur...

Page 15: ...e CR 5 70 Horizontal 70 40 Vertical Contrast ratio 300 1 Brightness 200 cd m2 typ Colors Displayed 16M Video Input Analog RGB 0 7V p p 75 or TTL 2 75V p p DB9 F Sync Separate H V TTL pos or neg or Com...

Page 16: ...16 03 VARTECH SYSTEMS HEADQUARTERS 11529 Sun Belt Ct Baton Rouge Louisiana 70809 Toll Free 800 223 8050 International Phone 001 225 298 0300 Fax 225 297 2440 E mail sales vartechsystems com www varte...

Reviews: