background image

SA

FET

Y N

OTE

S

DE

VIC

E F

EATU

RE

S

HA

RD

W

ARE

 PAC

KAG

E

HAR

DW

AR

CO

MP

ON

EN

TS

BAT

TER

INS

ERT

ION

TAK

ING


ME

ASU

REME

NTS

OTH

ER S

CREE

NS
M

AIN

TEN

AN

CE

TRO
UB

LE-

SH

OOT

ING

W

AR

RAN

TY

 AN

AF

TER

-SER

VIC

E

SPE

CIF

ICA

TIO

NS

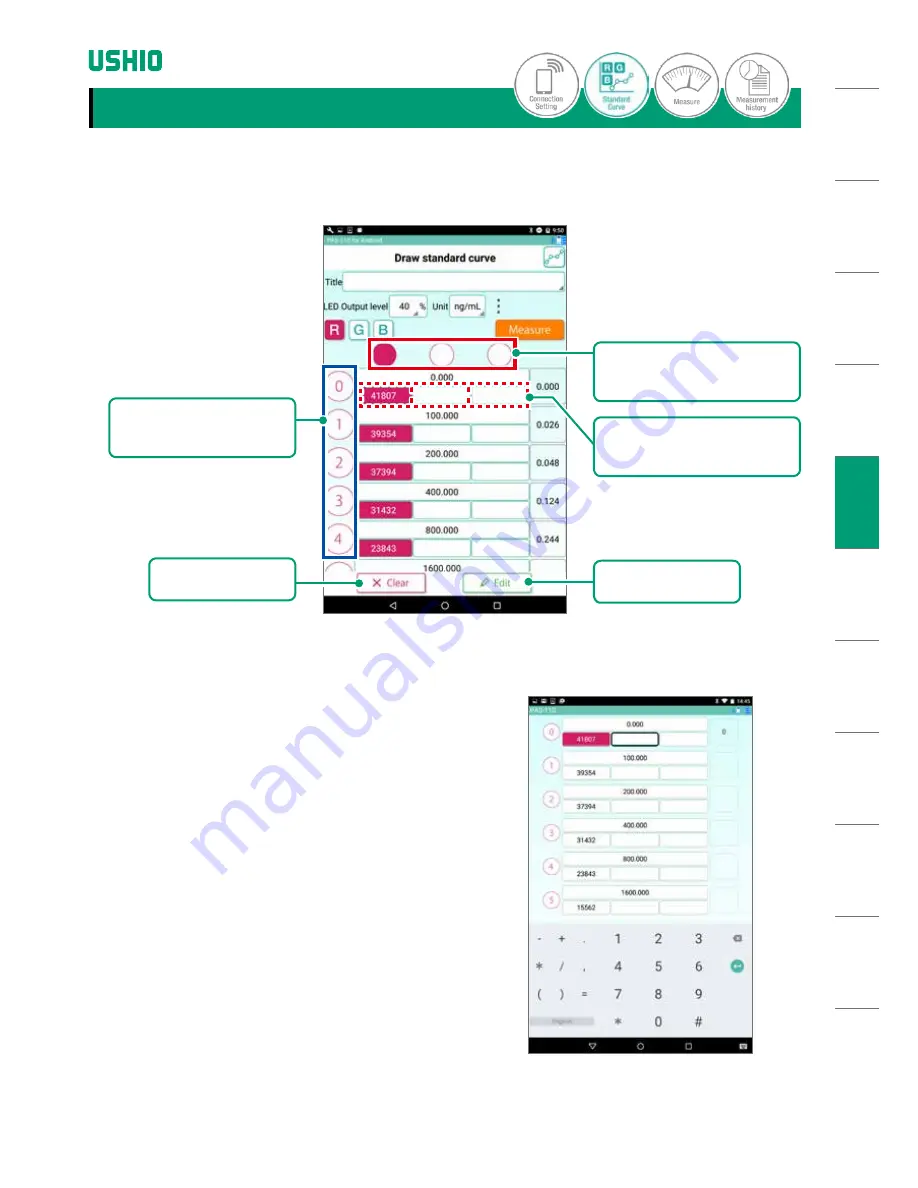
Illustration 3-11: 

Draw Standard Curve Screen

Illustration 3-12: 

Directly Editing Data Values

TAKING MEASUREMENTS 

3-6. Other Functions

This section describes miscellaneous functions of the app.

(1) Data Clear Function

Tap the Clear Button 

 to clear all data.

(2) Data Edit Button

 Tap the Known Concentration Data Input Area, then
the Edit Button 

 to directly edit the data values

(Illustration 3-12).

TAK

ING


ME

ASU

REME

NTS

Edit Button

 Graph Data Column

Selection Button

③  

Known Concentration

Data Input Area

Clear Button

 Graph Data Row

Selection Button

24

Copyright © 2016, USHIO INC. All Rights Reserved.

Summary of Contents for Picoexplorer PAS-110

Page 1: ...hange without notice Due to design improvements and or specification and app changes PiCOEXPLORERTM configuration may change without notice All company names and products names in this manual are the...

Page 2: ...e thru a USB connector use a PC with a limited energy circuit USB output or an AC adapter with a limited energy circuit used to power PCs CAUTION HANDLING OF PHOTO ABSORBANCE SENSOR l This device is f...

Page 3: ...object on factory lines which require licensing low power wireless transmitters which do not require licensing and amateur wireless transmitters all of the above designated herein as other wireless t...

Page 4: ...n If this equipment does cause harmful interference to radio or television reception which can be determined by turning the equipment off and on the user is encouraged to try to correct the interferen...

Page 5: ...reless Connection 12 3 Graphing the Standard Curve 14 3 1 Measuring Baseline Data 15 3 2 Measuring Known Concentrations 17 3 3 Graphing the Standard Curve 19 3 4 Calibration Curve Loading Function 20...

Page 6: ...sorbance sensor l Download the special app on to a Bluetooth enabled tablet to enable wireless access to the measurements made by the photo absorbance sensor l The high sensitivity yet extremely compa...

Page 7: ...Watson 137 211c 0 2mL tube Power Switch Turns unit on and off Battery Cover Open to insert batteries Status Light Steady Red check battery level Steady Purple powered and connected via Bluetooth Low E...

Page 8: ...ries CAUTION Use only AAA type batteries Use of other types may damage the unit Follow the 3 steps below when replacing batteries 1 Open the battery cover on the back side of the unit 2 Insert batteri...

Page 9: ...w for taking basic measurement readings 1 Turn on unit power The status light will turn red If battery level falls too low the red light will begin blinking 2 Open the measurement chamber lid and set...

Page 10: ...ve Screen Concentration Measurement Screen Measurement History Screen Standard Curve Graph Screen 6 Measure sample concentration Refer to P26 4 Taking Measurements 7 Check previous measurements Refer...

Page 11: ...device status P31 Measurement Button Goes to the Measurement Screen to take measurements P26 Help Button Goes to the Help Screen P34 Connection Setting Button To connect to the hardware unit goes to t...

Page 12: ...tion 2 1 Connection Setting Screen Bluetooth Device Address Shows the last Bluetooth device connected to Connect Button Press to connect Device Search Button Search for devices to connect to TAKING ME...

Page 13: ...ckground color of the address will change indicating selection 3 Tap the Connect Button to begin connecting 4 Once the connection is established tap the Return Button to return to the top screen TAKIN...

Page 14: ...rst prepare a set of samples of known concentration The procedure is as follows 1 measure baseline data 2 measure known concentration sample data 3 check the results by graphing the data CAUTION Befor...

Page 15: ...used for baseline concentration measurement into the measurement chamber of the photo absorbance sensor 2 Set the LED optical output level by entering percentages into the LED Output Level box You can...

Page 16: ...measurement is finished the value will be displayed in white font This data will be used to make the graph of the curve refer to Page 19 5 Tap the RGB Select Button to check that the baseline data val...

Page 17: ...a series of samples of known concentrations 1 Set a sample into the measurement chamber of the photo absorbance sensor TAKING MEASUREMENTS Standard Curve Graph Display Button Measurement Button Absorb...

Page 18: ...asurement Input Area to select A black outline will be displayed 5 Tap the Measure Button to begin measurement The measured value will be displayed in white font 6 The Absorbance Value Display will sh...

Page 19: ...e Standard Curve Graph Screen you will see a display with the concentration on the X axis and the absorbance on the Y axis Illustration 3 9 Least Squares Fit Button 2 Tap the Least Squares Fit Button...

Page 20: ...Select the calibration curve data and tap the Load button The data loaded from the CSV file is displayed on the calibration curve creation screen If the added unit is unavailable after saving the cali...

Page 21: ...TAKING MEASUREMENTS 3 5 Unit Maintenance Function How to add a unit 1 Tap the unit maintenance button on the calibration curve creation screen to display the unit maintenance screen TAKING MEASUREMENT...

Page 22: ...EENS MAINTENANCE TROUBLE SHOOTING WARRANTY AND AFTER SERVICE SPECIFICATIONS TAKING MEASUREMENTS 3 When you enter a unit it is added to the unit selection list on the calibration curve creation screen...

Page 23: ...AKING MEASUREMENTS How to delete a unit 1 Tap the unit delete select button on the unit maintenance screen to display the delete button TAKING MEASUREMENTS 2 When you tap the delete button the line is...

Page 24: ...NG MEASUREMENTS 3 6 Other Functions This section describes miscellaneous functions of the app 1 Data Clear Function Tap the Clear Button to clear all data 2 Data Edit Button Tap the Known Concentratio...

Page 25: ...a Column Selected Illustration 3 14 Entire Graph Data Row Selected TAKING MEASUREMENTS 3 Graph Data Column Selection Tap the Graph Data Column Selection Button to select an entire column of displayed...

Page 26: ...into the measurement chamber 2 Enter the Title of the run into the Title Input Box 3 Tap the Measure Button to begin measurement The concentration will be calculated and displayed If calculated concen...

Page 27: ...stration 4 2 Concentration Units Selection Illustration 4 3 Example Selected G Data Values Displayed TAKING MEASUREMENTS 7 Tap the Concentration Units Selection Button then Select RGB to display the R...

Page 28: ...Appendix 4A Applying the Absorbance Multiplier to PiCOEXPLORER Measurements using Application PAS 115 UI for Android Devices 1 Access the Maintenance Menu in the lower right hand screen 2 Hit Maintena...

Page 29: ...29 3 Hit Function Settings under the Maintenance Menu 4 Type the value into the Absorbance Multiplier box Note Changing the Absorbance Multiplier will erase any existing standard curve...

Page 30: ...B Taking Timed Measurements with PiCOEXPLORER using Application PAS 115 UI for Android Devices 1 Hit the Measure section of the App from the home screen 2 Hit the clock in the upper right hand corner...

Page 31: ...etween 2 600 seconds and measurement duration 2 to 3600 seconds Then hit begin To stop timed measurements hit the clock again or return to the home screen Measurements will automatically end when the...

Page 32: ...TAKING MEASUREMENTS 5 Displaying Previous Measurements Press the Measurement History Button on the top screen to move to the Measurement History Screen Illustration 5 1 1 Tap the Title Input Box and...

Page 33: ...stration 5 3 Display of Measurement Data TAKING MEASUREMENTS 2 Tap the Concentration Units Selection Button and select RGB illustration 5 1 to display the RGB sensor data for that run 3 Tap the Least...

Page 34: ...d data com ushio pas110 files Note With iOS follow the steps below to save the file 1 Connect the tablet and computer 2 Open iTunes 3 Select the connected tablet 4 Select App below Settings 5 Select P...

Page 35: ...AND AFTER SERVICE SPECIFICATIONS Illustration 7 1 Info Screen OTHER SCREENS 7 Info Screen Tap the Info Button on the top screen to move to the Info Screen illustration 7 1 The Info Screen displays in...

Page 36: ...stration 8 1 Save Screen OTHER SCREENS 8 Save Screen Tap the Save Button on the top screen to move to the Save Screen illustration 8 1 The Save Screen displays the Diagnostics and Function Settings Bu...

Page 37: ...play set to English OTHER SCREENS The Diagnostics Button is used by USHIO INC to check device operation Please do not use it Tap the Function Settings Button to move to the Function Settings Screen On...

Page 38: ...en OTHER SCREENS 9 Help Screen Tap the Help Button on the top screen to move to the Help Screen Illustrations 9 1 This screen provides a weblink to the user s manual troubleshooting guide and other re...

Page 39: ...ain with a clean dry cloth to remove all excess moisture Measurement Chamber Do not use a stiff cloth to wipe the optical unit inside the chamber Doing so can easily damage this sensitive component Re...

Page 40: ...cinity Move device and receiver away from such devices Too many possible receivers nearby Turn off power to other nearby receivers Physical object blocking signal between device and receiver Relocate...

Page 41: ...ss than a 10 tilt from horizontal Sample concentration too strong Adjust output strength of LEDs Make sure you have used correct volume and type of sample and diluted correctly Sample concentration to...

Page 42: ...BLE LAW USHIO INC EXPRESSLY DISCLAIMS ALL WARRANTIES AND CONDITIONS REGARDING THIS DEVICE WHETHER EXPRESS IMPLIED OR STATUTORY AND INCLUDING BUT NOT LIMITED TO ANY WARRANTY OF MERCHANTABILITY OR FITNE...

Page 43: ...ontacting your dealer be sure to provide the following information Model Number Serial Number Date of Purchase Description of Problem as detailed as possible Usage History as detailed as possible PiCO...

Page 44: ...0 nm 455 630 nm Blue 460 nm 400 540 nm Communication Interface Bluetooth low energy Bluetooth smart Frequency of operation 2402 2480 MHz Type of modulation GFSK Channel spacing 2 MHz Channel number 40...

Page 45: ...5440 Cerritos Avenue Cypress CA 90630 www ushio com Ushio America Inc EA REV 1 2 Copyright 2016 USHIO INC All Rights Reserved...

Reviews: