Page 28
WELD SENTRY 2
Press
◄
/
►
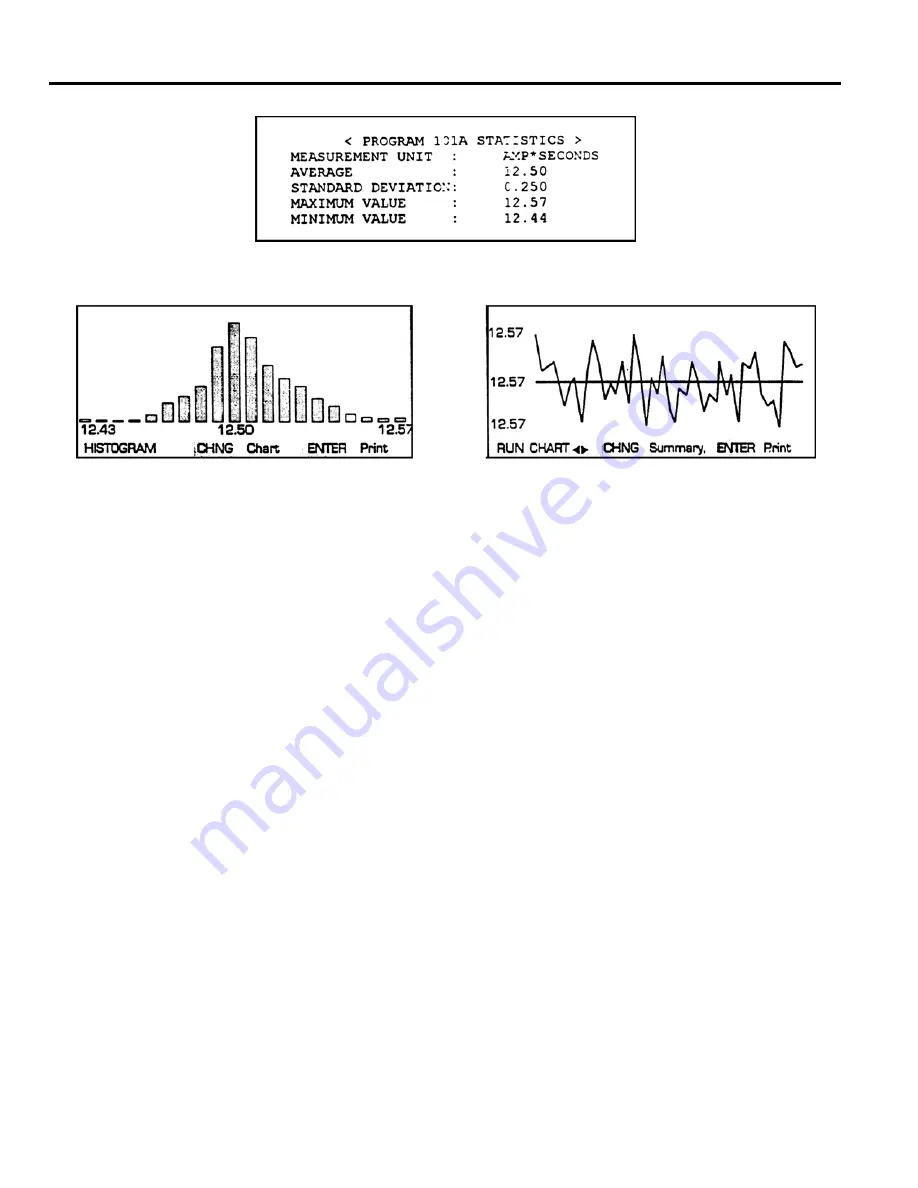
to view Programs A-E, press [ENTER] to print a summary, press [CHNG] to display the Charts.
The range of the graphs is set by calculating the difference between the Average and both the Maximum and
Minimum. The largest difference is used to set the high and low for the graphs. In the example above:
Max – Avg
= 12.57 – 12.50 = .07 difference > Largest difference
Avg – Min
= 12.50 – 12.44 = .06 difference
High Range = Avg. + Largest Difference = 12.50 + .07 = 12.57
Low Range = Avg. - Largest Difference = 12.50 - .07 = 12.43
HISTOGRAM - The histogram is a frequency distribution of the data. The range between the "High" and
“Low” values is divided into 20 “bars”, each representing 1/20th of the total range. The height of each bar
represents the number of welds in that division. Thc number of welds is not shown on the screen, however,
it is shown on printouts. A stable process should have a "normal', bell-shaped distribution. The larger the
number of welds included in the sample data, the more reliable the statistics will be. Always use at least
100 welds. Press [ENTER] to print the graph. Press [CHNG] to display the Run Chart.
RUN CHART - The Run Chart shows a data point for each weld. in sequence by weld number, with the
most recent weld at the right of the chart. The weld number is not displayed on the screen, however, is
shown on printouts. The “High”, “Low” and Average measurement values are displayed at the left of the
screen. The actual measurement value for each weld is not shown, only the relative position. To obtain the
actual measurement value of each weld, data must be transmitted during the weld process and printed or
saved to a computer file. The Run chart shows how the measurement values have changed over time. A
stable process should have welds distributed both above and below the average line. When the data begins
to increase either above or below the average line, it may indicate that the process has begun to “drift”. This
can result from dirty electrodes, increased heat due to resistance, or some other process change which occurs
over time. Press [ENTER] to print the chart. Press [CHNG] to display the Summary Screen. Press
[MENU] to return to the Main Menu.
Summary of Contents for 3-131-XX
Page 5: ......


