©2007 Key Curriculum Press
Discovering Algebra Calculator Notes for the Texas Instruments TI-83 and TI-83/84 Plus
15
Note 1E • Histograms (continued)
TI-83 and TI-83/84 Plus
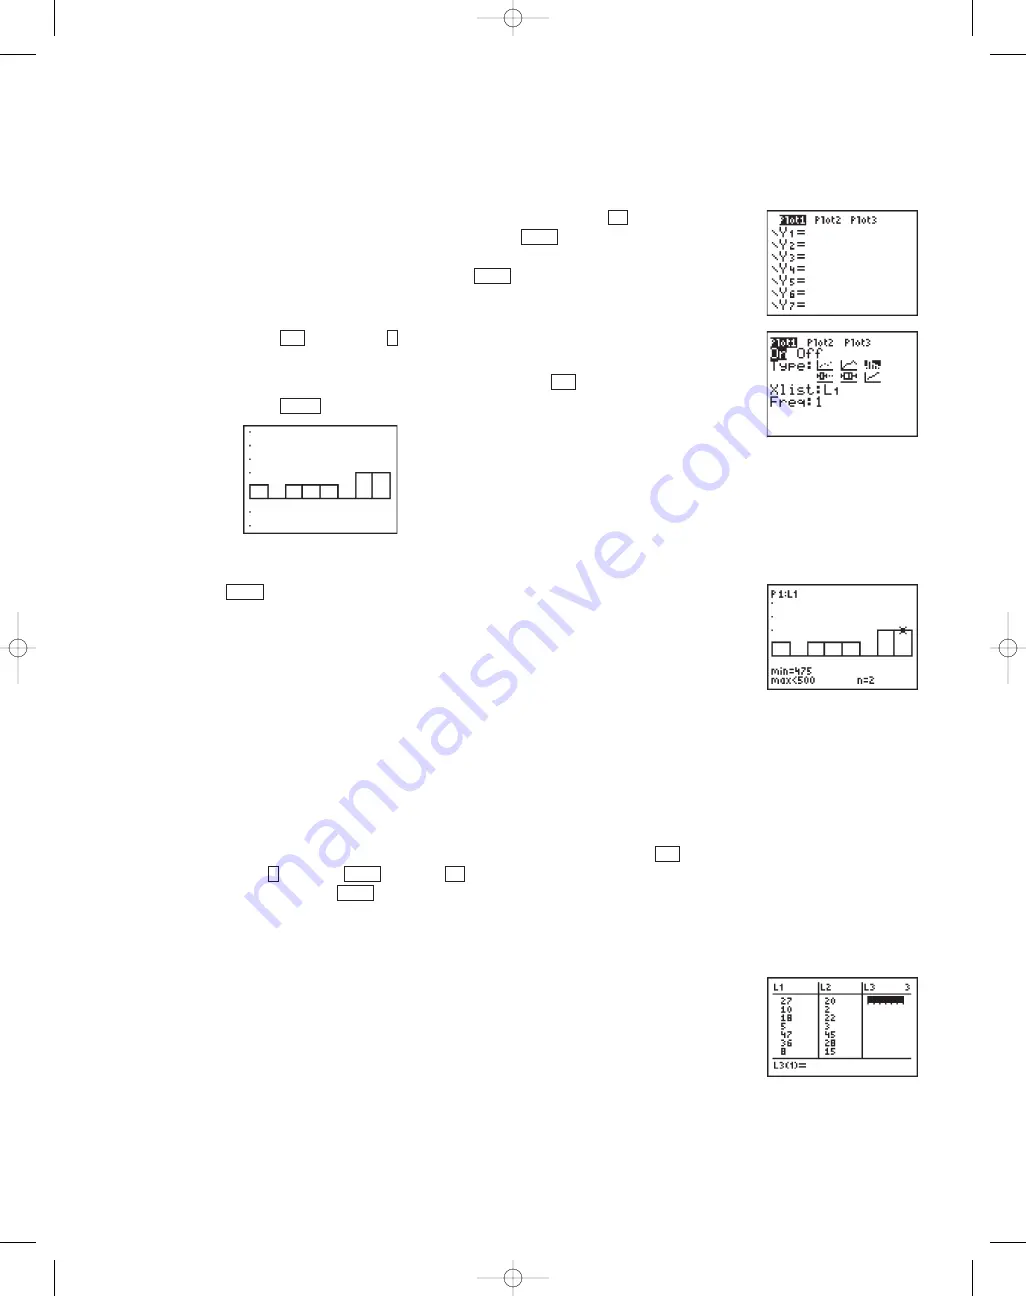
Displaying the Histogram
This example assumes the data is in list
L
1
, but you can choose any list.
a. Clear or turn off any equations in the
Y
screen. (Press . Place
the
cursor anywhere in an equation and press
to delete the equation.
Or, move the cursor over the highlighted equal sign of any equation
you don’t want to delete, and press
to turn off the equation.)
b. Press
[STAT PLOT]
(
Plot1...
). (You can choose any of the three
stat plots.)
c. Select
On, Histogram
,
L
1
,
1
. (To select list
L
1
press
[L
1
]
.)
d. Press .
Tracing on a Histogram
Press
. The trace option always starts with the stat plots and then moves
to equations in the
Y
screen (if any are turned on), even if you can’t see them
in the current window. Be sure to turn off any plots and any equations you do
not want to see or trace.
Errors
You will get
ERR:STAT
if you try to create a histogram with more than
47 intervals (bars). Make the Xscl value larger to correct this error. You may
also get an error message if you haven’t turned off a plot you’re not interested
in seeing or you have changed the data or the window settings.
Clean-up
When you are finished graphing histograms, you might want to turn off all
the plots so that they don’t interfere with other graphing screens. Press
[STAT PLOT]
(
PlotsOff
)
, or press
, arrow to any plot that is
highlighted, and press
.
Note 1F • Scatter Plots
Entering the Data
Enter the x-coordinates (horizontal axis) into one list and the y-coordinates
(vertical axis) into another list. List
L
1
and list
L
2
are used for this example.
(See Note 1B if you need help entering the data.)
ENTER
Y
ENTER
4
2nd
TRACE
GRAPH
2nd
1
2nd
ENTER
CLEAR
Y
(continued)
DA2CN_773_01.qxd 10/19/05 9:53 Page 15


