©2007 Key Curriculum Press
Discovering Algebra Calculator Notes for the Texas Instruments TI-83 and TI-83/84 Plus
17
Graphing More Than One Scatter Plot at a Time
The calculator can graph up to three scatter plots at the same time. Follow the
directions for displaying a scatter plot and set up
Plot2
,
Plot3
, or both. Be sure
the lists in which you’ve entered the data match the lists you select when setting
up each scatter plot. Be sure to choose a different mark for each plot.
Errors
An
ERR:DIM MISMATCH
message means that the two lists do not have the same
number of entries. This could also happen if you left a stat plot on that you’re
not using, or if you named the wrong list when you set up the scatter plot.
If the graph does not look like you think it should, try any (or all) of the
following: Clear or turn off all equations in the
Y
screen. Press
[FORMAT]
and select
GridOff
. Press
and check that the calculator is set to
Func
.
Clean-up
When you are finished graphing scatter plots, you might want to turn off
all the plots so that they don’t interfere with other graphing screens.
Press
[STAT PLOT]
(
PlotsOff
)
or press
, arrow to any plot that is
highlighted, and press
.
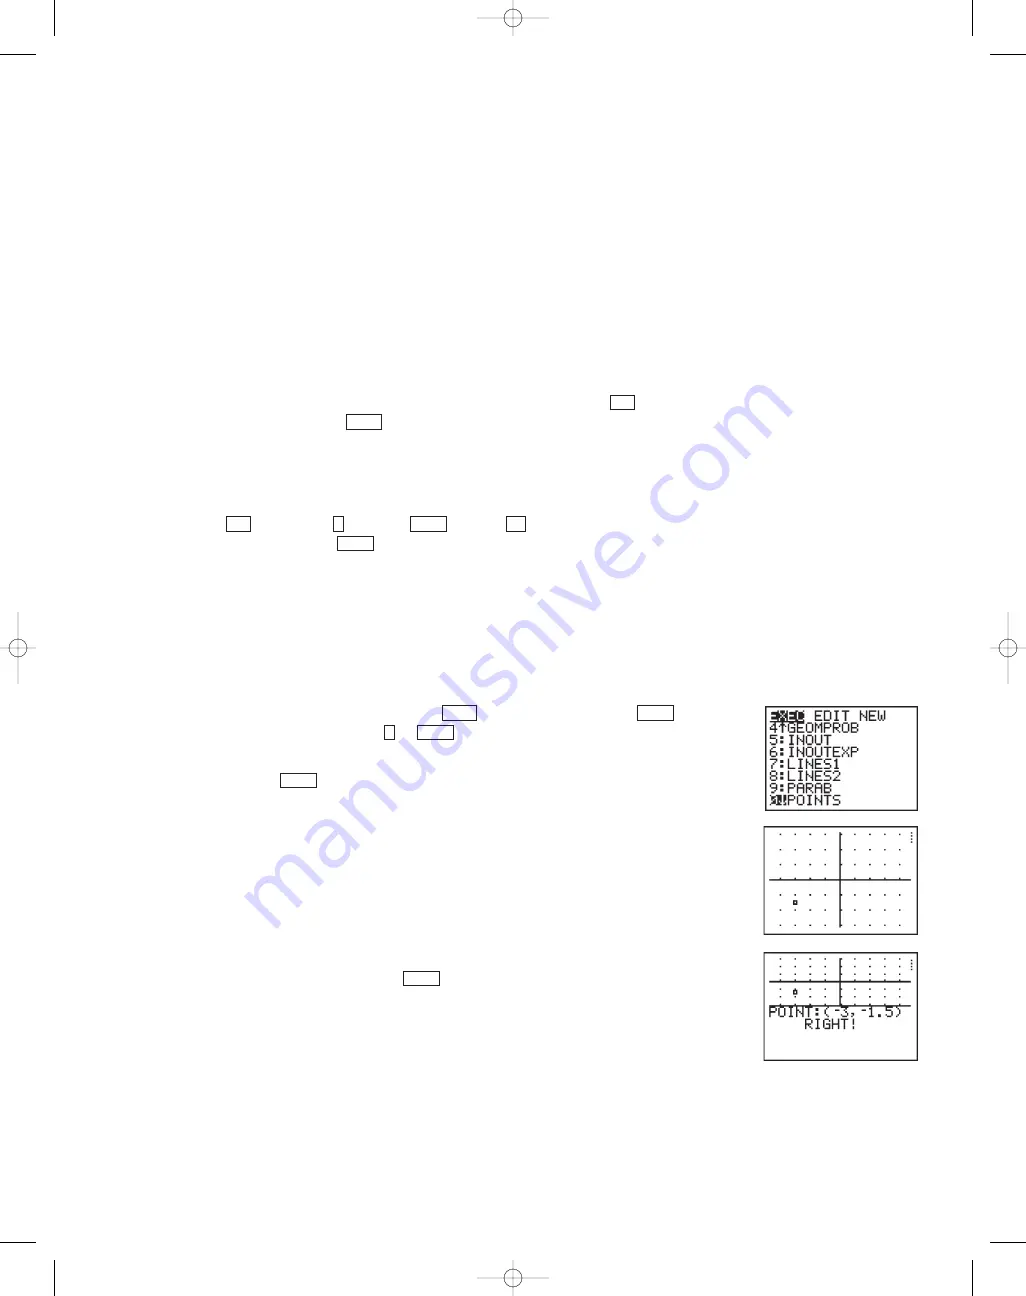
Note 1G • POINTS Program
First, link or manually enter the program into your calculator. (See Note 0F or
Note 0G.) The
POINTS
program plots a single point in a graphing window that
measures from –4.7 to 4.7 on the horizontal axis and from –3.1 to 3.1 on the
vertical axis. You identify and enter the coordinates of the point rounded to the
nearest 0.5 units.
a. To execute the program, press
, arrow to
POINTS
, press
twice, and then press or
to select
1:PLAY
.
b. Study the screen and determine the coordinates of the marked point.
c. Press .
d. Enter the x-coordinate, a comma, the y-coordinate, and close the
parentheses. Then press
.
ENTER
ENTER
ENTER
1
ENTER
PRGM
ENTER
Y
ENTER
4
2nd
MODE
2nd
Note 1F • Scatter Plots (continued)
TI-83 and TI-83/84 Plus
(continued)
DA2CN_773_01.qxd 10/19/05 9:53 Page 17


