PLOTTING
7.3
Plotter Controls
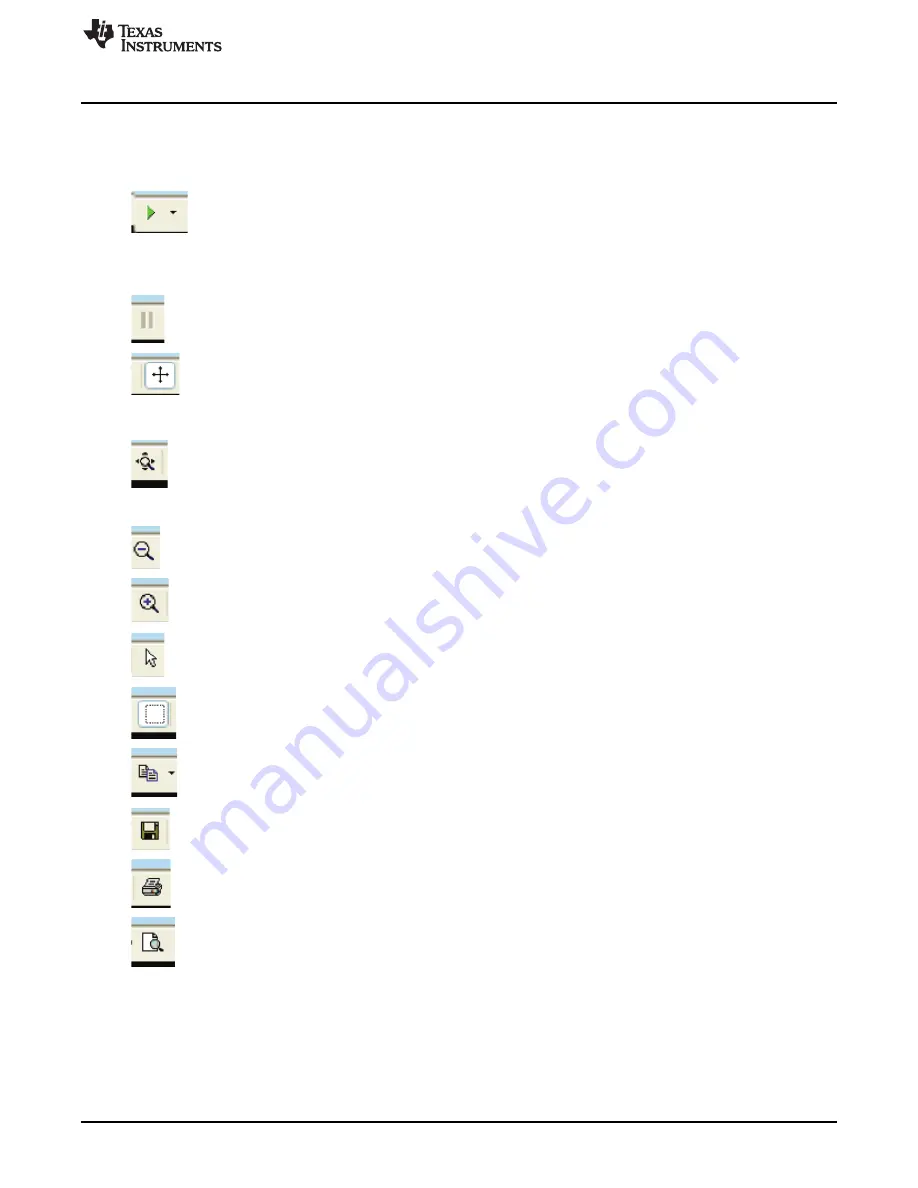
Plotter controls are shown slightly magnified in the upper left of the capture above. From the left, they
control:
RESUME TRACKING - causes the strip-chart to resume automatically tracking
changes in voltage, time, or temperature
–
in other words, resume auto-ranging. This
green arrow is illuminated after manually zooming in or opening a window in the
default view. The default is auto-ranging is enabled. The small black down-arrow
opens a small menu of selections controlling the automatic tracking. Whether
displayed or not, data is always captured on each poll refresh.
PAUSE DISPLAY
–
momentarily stops auto-tracking. To resume, use the RESUME
TRACKING button described above.
SCROLL X-Y
–
After clicking this control, the display (data) window can be moved by
left-clicking the mouse button in the display and moving the mouse. Use RESUME
TRACKING to restore the display. Each data set (VCn voltages, VBRICK, temperature,
time) scale can be individually moved by clicking and holding the left mouse button on
the units field and scrolling up-down or left-right (time scale).
EXPAND X-Y
–
This control allows zooming in or out on the displayed scale. Choose
this button, then click and hold the left mouse button to operate. Each data set (VCn
voltages, VBRICK, temperature, time) scale can be individually zoomed by clicking and
holding the left mouse button on the units field and scrolling up-down or left-right (time
scale).
ZOOM OUT
–
click on a scale, then click this button to move out in incremental steps.
ZOOM IN
–
similar but opposite action to Zoom out, above.
SELECT
–
allows selecting data or scales (opposite of window mode, described next)
WINDOW
–
click this button, then drag a zoom box around an area in the display to
zoom in. This mode is canceled by clicking on the SELECT arrow described above.
The display is restored by using the TRACKING RESUME button, above.
COPY TO CLIPBOARD
–
the data is copied to the clipboard for inclusion in a
document or spreadsheet. A small menu allows selecting the numeric data to copy, or
the graphic.
SAVE
–
the graphic to a .PNG file
–
the graphic to a printer
PRINT PREVIEW
–
see what the graphic will look like on your printer before printing.
15
SLUU437B
–
October 2010
–
Revised May 2011
bq76PL536 EVM Quick Start Guide
Copyright
©
2010
–
2011, Texas Instruments Incorporated


