3-20 Function Graphing
8303FUNC.DOC TI-83 international English Bob Fedorisko Revised: 02/19/01 12:16 PM Printed: 02/19/01 1:35
PM Page 20 of 28
8303FUNC.DOC TI-83 international English Bob Fedorisko Revised: 02/19/01 12:16 PM Printed: 02/19/01 1:35
PM Page 20 of 28
To display the
ZOOM
menu, press
q
. You can adjust the
viewing window of the graph quickly in several ways. All
ZOOM
instructions are accessible from programs.
ZOOM MEMORY
1: ZBox
Draws a box to define the viewing window.
2: Zoom In
Magnifies the graph around the cursor.
3: Zoom Out
Views more of a graph around the cursor.
4: ZDecimal
Sets
@
X
and
@
Y
to 0.1.
5: ZSquare
Sets equal-size pixels on the
X
and
Y
axes.
6: ZStandard
Sets the standard window variables.
7: ZTrig
Sets the built-in trig window variables.
8: ZInteger
Sets integer values on the
X
and
Y
axes.
9: ZoomStat
Sets the values for current stat lists.
0: ZoomFit
Fits
YMin
and
YMax
between
XMin
and
XMax
.
When you select
1:ZBox
,
2:Zoom In
, or
3:Zoom Out
, the
cursor on the graph becomes the zoom cursor (
+
), a
smaller version of the free-moving cursor (
+
).
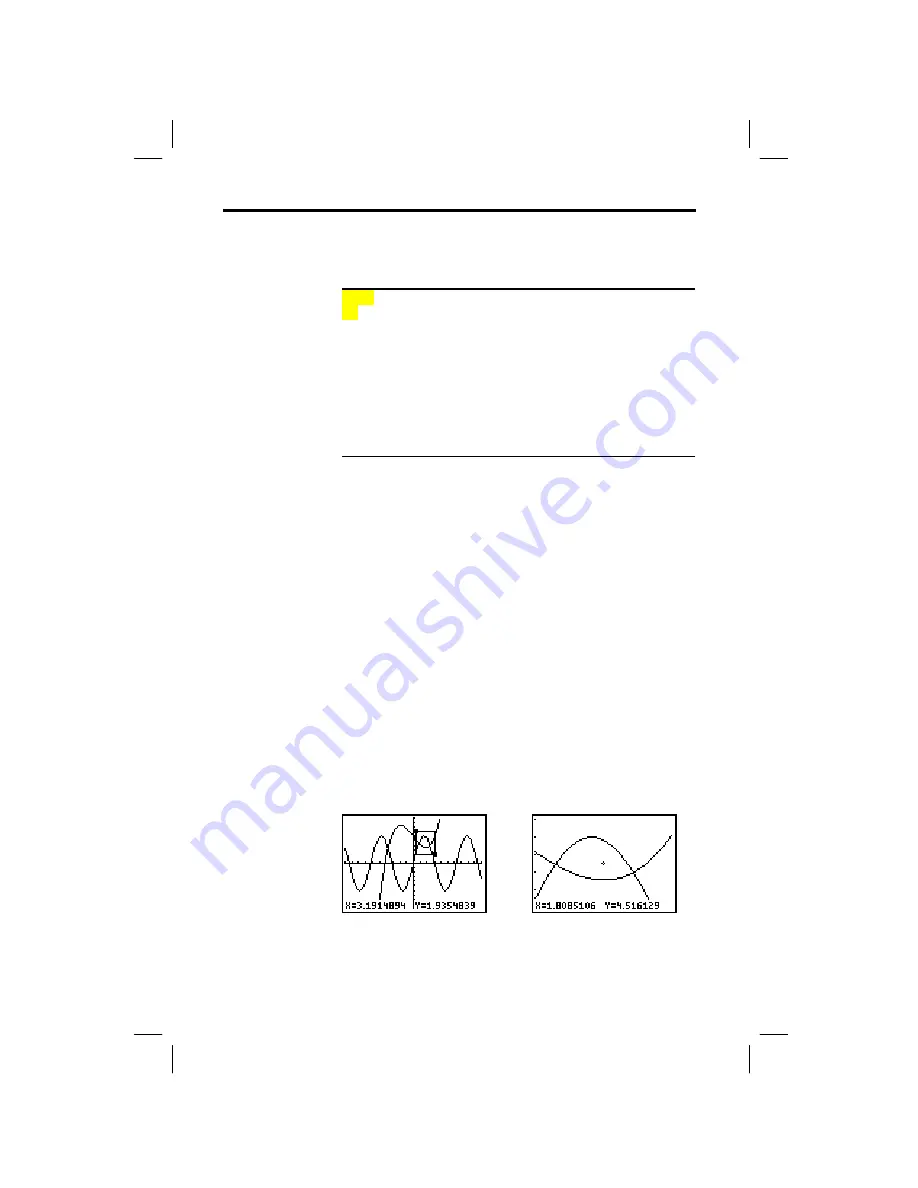
To define a new viewing window using
ZBox
, follow these
steps.
1. Select
1:ZBox
from the
ZOOM
menu. The zoom cursor is
displayed at the center of the screen.
2. Move the zoom cursor to any spot you want to define as
a corner of the box, and then press
Í
. When you
move the cursor away from the first defined corner, a
small, square dot indicates the spot.
3. Press
|
,
}
,
~
, or
†
. As you move the cursor, the sides
of the box lengthen or shorten proportionately on the
screen.
Note: To cancel
ZBox
before you press
Í
, press
‘
.
4. When you have defined the box, press
Í
to replot
the graph.
To use
ZBox
to define another box within the new graph,
repeat steps 2 through 4. To cancel
ZBox
, press
‘
.
Exploring Graphs with the ZOOM Instructions
ZOOM Menu
Zoom Cursor
ZBox


