


Vista 5 M2 Digital Mixing System
6 TFT Meters
Date printed: 09.06.11
SW V4.5
see e.g. all auxiliary outputs – or to all groups, all programme masters, direct
outputs, bus outputs, N–1s, matrix channels, etc.
In addition there are user pages assignable to whatever is desired via the strip
set-up. There are four configurable user pages. One of them has ten slots in
one row, the next one has 20 slots in two rows, and the next two have 40 half-
width slots in two rows. So if calling up page four, there are 40 meters, and
they can be virtually anything. The two meter slots at the right of the control
bay TFT screen continuously show PFL and CR levels.
The illustration on the previous page is an example of a meter screen with
mono, stereo and surround channels, as well as different views in the lower
area – such as metering of the L2 channel, history, bus assignment and sur-
round view. Further information is displayed as well, such as gain reduction
or surround signal type.
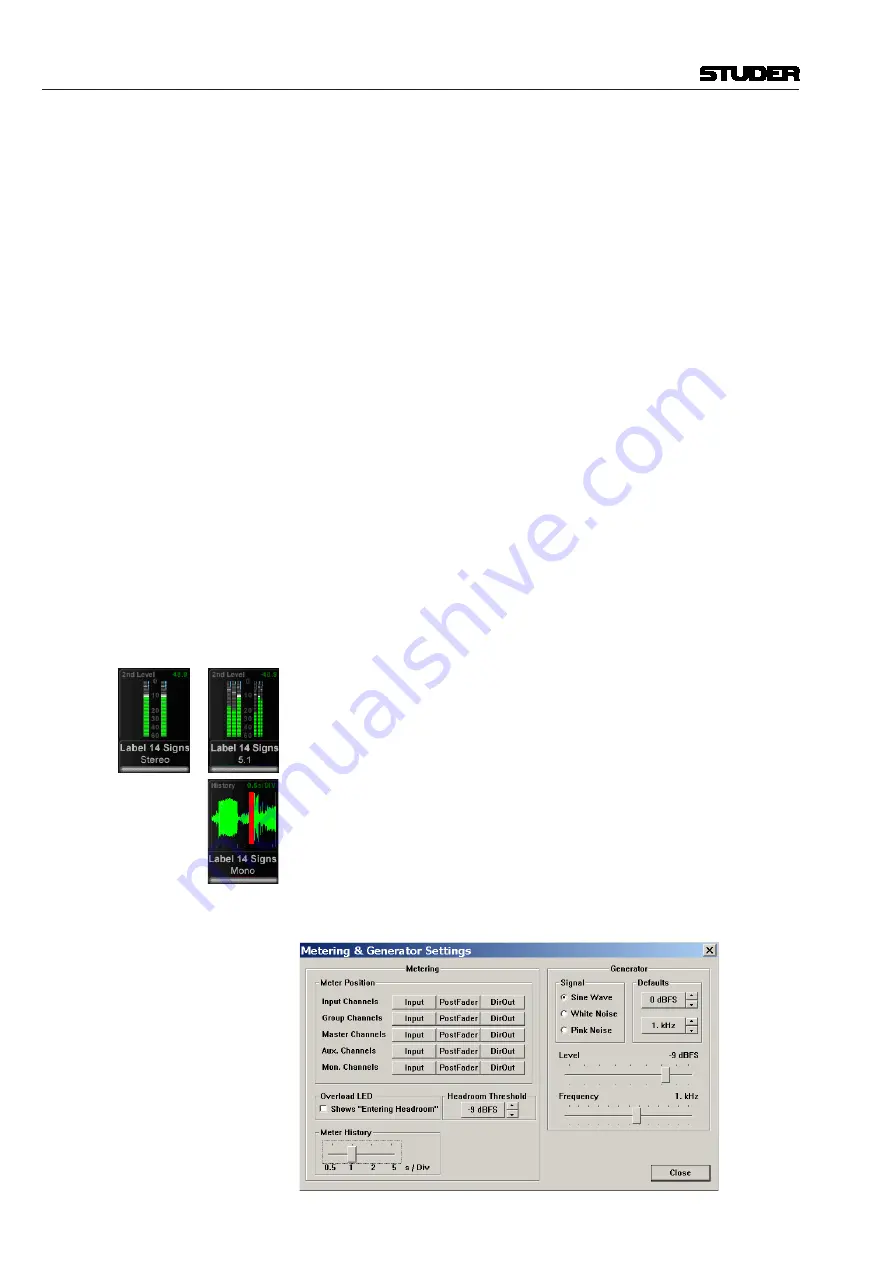
Level Meters
The level meter bargraphs indicate digital peak values including headroom
of mono, stereo, 5.1 and N–1 channels. The meter scale always is in dB
FS
with 0 dB
FS
at the top, with an additional overload segment clearly indicating
overloads. Stereo meters feature a correlation meter on top of the meter bars,
both on stereo inputs as well as on stereo master channels.
Above the level bargraph area gain reduction meters are added. Clipping is
displayed by turning the white bargraph section (i.e., the segments above the
headroom threshold) over to red. The meter tap point can be selected from
input, post fader and direct output level of the corresponding channel.
It is possible to use the red overload indicator above the meters to indicate a
level just entering the configured headroom, rather than clipping. This is set
in the GC’s ‘Meter/Generator’ window.
The area below the large bargraphs provides additional visual information,
depending on the channel type and on what the operator prefers to see.
When the desk is in ‘two layer’ mode, a smaller bargraph meter of the L2
channel (e.g. a spare microphone) is always shown.
Furthermore there is the option to display the audio waveform of the signal
that has passed the channel, so the operator can see the history of the audio
back to a configurable time of up to 50 seconds. The waveform of the audio-
signal not only gives very clear information about signal loss or overload
(which colours that part of the waveform in red) but also indicates the char-
acter of the signal, as in the age of DAWs most operators are used to interpret
signals by looking at their waveform. The speed of the meter history view
can be set in the Metering & Generator Settings window, as shown below.


