' SLS loudspeakers Inc., 2002. All rights reserved.
9
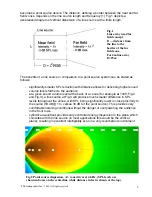
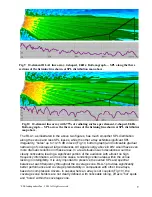
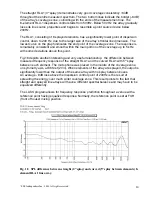
Fig.10 10-element line array with 75% of radiating surface per element, J-shaped, 8 kHz.
Bottom graph — SPL across the three sections of the listening line shown at SPL distribution
map above.
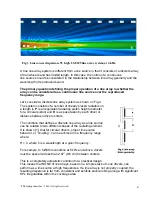
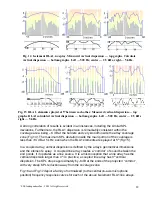
The RLA1, as illustrated in the above two figures, has much smoother SPL distribution
along the venue and less SPL losses, while the other array exhibits significant SPL
irregularity, “holes” up to 10-15 dB in level (Fig.10, bottom graph) and noticeable gradual
narrowing of coverage at large distances. All signal energy above 8 kHz would have even
more dramatic reduction in these areas. In a real situation such deviations would be
clearly noticeable, leaving a significant portion of the audience with almost no high
frequency information, and in some cases, rendering certain areas within the venue
lacking in intelligibility. It is very important to preserve the overall SPL and spectral
balance at each frequency throughout the coverage zone. RLA-1 provides significantly
better performance and coverage predictability in comparison with other line arrays,
based on compression drivers. In cases where an array is not coupled (Fig.10), the
coverage zone borders are not clearly defined, with noticeable lobing, off axis “hot” spots
and “holes” within the coverage zone.
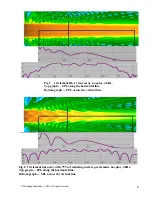
Fig.9 10-element RLA 1 line array, J-shaped, 8 kHz. Bottom graph — SPL along the three
sections of the listening line shown at SPL distribution map above.


