Silicon Radar SiRad Simple User Manual Download Page 14


User Guide (Version 2.2) of the 
SiRad Simple® Evaluation Kit 

- 14 - 

Save own settings:

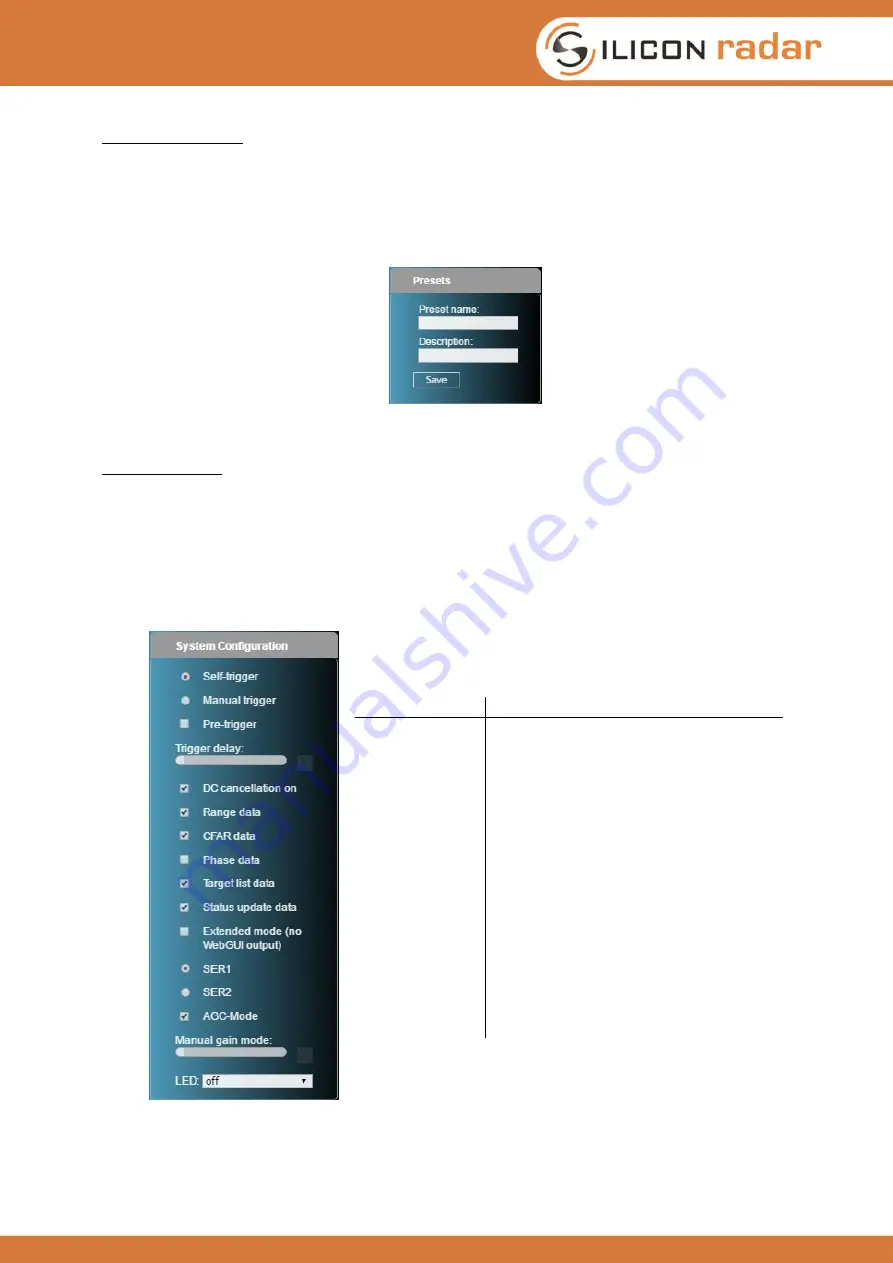
 To save your settings, click the ‘New’ button. The dialog in Figure 13 appears. 

Enter  a  preset  name and description for  your  settings  and click  ‘Save’.  All  settings  are stored  as 
cookies in your browser so that they are available next time when you open the browser. 

Please 

make sure that your browser saves and keeps cookies (Mozilla Firefox) or local storage is 
enabled (Chrome Browser) to enable this feature. Do not use a ‘private’ mode and do not set 
up your browser to delete all saved content each time you close the window. 


Figure 13: Save settings in the Presets tab of the Control Panel 


Delete  settings:

  To  delete  settings,  choose  a  preset  name  and  click  ‘Delete’.  In  case  you 

accidentally deleted one of the factory presets that are explained in Figure 12 (right), those will be 
automatically restored next time you open the browser. 
 

3.2.3 System Settings (System Configuration Tab) 

The  ‘System  Configuration’  tab  shown  in  Figure  14  is  used  to  control  the  kind  and  amount  of 
transmissions from the sensor.  


Setting 

Description 

Self-trigger 

sensor triggers itself continuously 

Manual trigger 

manual or external triggering mode 

Pre-trigger 

used to synchronize measurements 

Trigger delay 

set a delay between trigger and measurement 

DC cancellation 

switch DC offset compensation on 

Range data 

transmit distance data frames 

CFAR data 

transmit CFAR data frames 

Phase data 

transmit phase data frames 

Target list data 

transmit target list data frames 

Status update data  transmit status data update frames 
Extended mode 

switch to raw data output 

SER1 

connect to the sensor via WiFi or UART 

SER2 

<reserved> 

AGC-Mode 

switch automatic gain control on 

Manual gain 

set a gain (when AGC-Mode is switched off) 

LED 

choose an LED operating mode 


Figure 14: System Configuration tab of the Control Panel 


Summary of Contents for SiRad Simple

Page 1: ...se 24 Apr 17 Silicon Radar GmbH Version Document number Filename Page 2 2 UserGuide_SiRad_Simple 1 of 34 Silicon Radar GmbH Im Technologiepark 1 15236 Frankfurt Oder Germany fon 49 335 557 17 60 fax 4...

Page 2: ...2 2 3 Connecting to the Board via WiFi 11 2 2 4 Starting the Graphical User Interface Silicon Radar WebGUI 11 3 Getting Started with the Silicon Radar WebGUI 12 3 1 Understanding the User Interface 1...

Page 3: ...s the MTI Mode 27 4 2 14 There are too many targets The CFAR operator does not work 28 4 2 15 How is the distance information calculated 28 4 2 16 The update rate of the sensor is very low How can I i...

Page 4: ...ntrol Panel 14 Figure 14 System Configuration tab of the Control Panel 14 Figure 15 RF Parameters tab of the Control Panel 16 Figure 16 BB Processing tab of the Control Panel 17 Figure 17 Target Recog...

Page 5: ...Figure 1 right Figure 1 SiRad Simple Evaluation Kit left and graphical user interface right The SiRad Simple Evaluation Kit demonstrates the performance and parameters of the 122 GHz radar transceive...

Page 6: ...the I and Q output signals of the transceiver Analog to Digital converter to digitize the I and Q receiver signals microcontroller to do PLL setup ramp configuration A D conversion signal processing...

Page 7: ...R also see Section 3 2 3 1 Pin Description 5V 5V GD GND MT microcontroller TX MR microcontroller RX TR external trigger line WT WiFi TX WR WiFi RX 3 3V tolerant only Figure 2 External header J1 pinout...

Page 8: ...mper J2 for the WiFi module switched on and connect two jumpers between MT WR and MR WT Apply 5V to the 5V pin and GND to the any GD pin there are four of the external header J1 Figure 4 WiFi pinout o...

Page 9: ...ined in Section 2 1 2 UART and 2 1 3 WiFi Please configure the sensor board for either the UART mode for the USB connection or the WiFi mode before proceeding to one of the next sections The Evaluatio...

Page 10: ...ion of the software you can now optionally connect to this serial port using a terminal program such as PuTTY6 or Realterm7 with the following UART settings 230400 baud 8 bits 1 stop bit no flow contr...

Page 11: ...n Windows the IP address that was assigned by the sensor s WiFi module to your PC can be checked in the network manager Proceed to Section 2 2 4 for running the graphical user interface 2 2 4 Starting...

Page 12: ...the screen with the active view in orange scene canvas itself where the sensor data is displayed target list with the status fields on the right side of the screen draggable The control buttons on th...

Page 13: ...lhost 9090 is for communication via the USB port see Figure 11 left If you are using WiFi type in the IP address and the port 9090 of the sensor s WiFi module like in Figure 11 right for example 192 1...

Page 14: ...e 12 right those will be automatically restored next time you open the browser 3 2 3 System Settings System Configuration Tab The System Configuration tab shown in Figure 14 is used to control the kin...

Page 15: ...s DC cancellation activates the DC offset compensation of the ADC data Range data activates the transmission of the distance data frames which contain the distance spectrum data in dB for each distanc...

Page 16: ...4 Radar Frontend Settings RF Parameters Tab The RF Parameters tab in Figure 15 is used to control the radar frontend of the sensor For each radar measurement the frontend is driven with one or more fr...

Page 17: ...ramps The bandwidth should not exceed the maximum frequency fmax of the frontend minus the minimum frequency fmin of the frontend minus 200 MHz Base frequency set the start frequency of the frequency...

Page 18: ...R Hence higher values give slower measurements but better SNR However too many ramps may smear out the signal due to the phase noise of the system Downsampling determines how many samples are averaged...

Page 19: ...tion Description 0 3 Reserved 4 bins number of the distance bin which receives the data 5 mm data is displayed in mm depending on the accuracy 6 cm data is displayed in cm depending on the accuracy Fi...

Page 20: ...Protocol Description for further information about the sensor s communication protocol 3 3 Using the Main Menu The main menu is shown in Figure 21 Here you can select how the data should be displayed...

Page 21: ...ate from the TSLM value time since last measurement The Target list shown in Figure 24 bottom part is ordered by distance With every new measurement having the CFAR operator enabled the Target list is...

Page 22: ...e Options menu you can choose the coloring of the data between Magnitude Range target number Phase angles the phase angles are only colorized if the magnitude is larger than 120 dB and when the Phase...

Page 23: ...of the view relative to the specified axis The camera view can be changed using the mouse within the scene area A left click drag pans the camera position A right click drag changes the camera view a...

Page 24: ...uring processing but do not last longer than 3 times checking them The temporary error flags are removed automatically Persistent errors are errors that last longer than 3 times checking them and can...

Page 25: ...daptive nature of the CFAR operator it might happen that if two targets are too near to each other or are very different in magnitude one of them is rejected hidden by the CFAR operator such a target...

Page 26: ...ion 2 2 2 4 2 WebGUI 4 2 1 I cannot store presets in the Preset tab Please make sure you are not working in the private mode of your browser and you have enabled cookies since the presets are stored a...

Page 27: ...tab does not show the min max frequencies properly You can try a manual min max frequency scan by clicking the fscan button three times 4 2 9 How do I choose a base frequency The base frequency shoul...

Page 28: ...ability to separate two targets in range The resolution is only dependent on the selected bandwidth With 1 GHz bandwidth the resolution is 15 cm 6 GHz bandwidth equals 2 5 cm resolution In practice ta...

Page 29: ...l the sensor with your own software or third party software like MATLAB 4 4 2 Can I activate raw data only or FFT data only output Yes Please read the Protocol Description about how to set up the sens...

Page 30: ...ll Package into the stm32flash folder Edit the batch file stm32flash bat and replace the COM port with the COM port of your USB to UART cable and the firmware name with the desired firmware marked her...

Page 31: ...Edit the batch file esptool bat and replace the COM port with the COM port of your USB to UART cable and the firmware name with the desired firmware marked here esptool bz 1M cp COMx cf websocket_mini...

Page 32: ...User Guide Version 2 2 of the SiRad Simple Evaluation Kit 32 6 Mechanical Drawing Figure 37 Mechanical drawing of the SiRad Simple Evaluation Kit...

Page 33: ...the critical uses policy set forth below CRITICAL USE EXCLUSION POLICY BUYER AGREES NOT TO USE SILICON RADAR GMBH S PRODUCTS FOR ANY APPLICATION OR IN ANY COMPONENTS USED IN LIFE SUPPORT DEVICES OR T...

Reviews: