16
FP-BA-e-1610
2. Connect the force gauge with the PC by using a USB cable
3. Start the force gauge and make it work
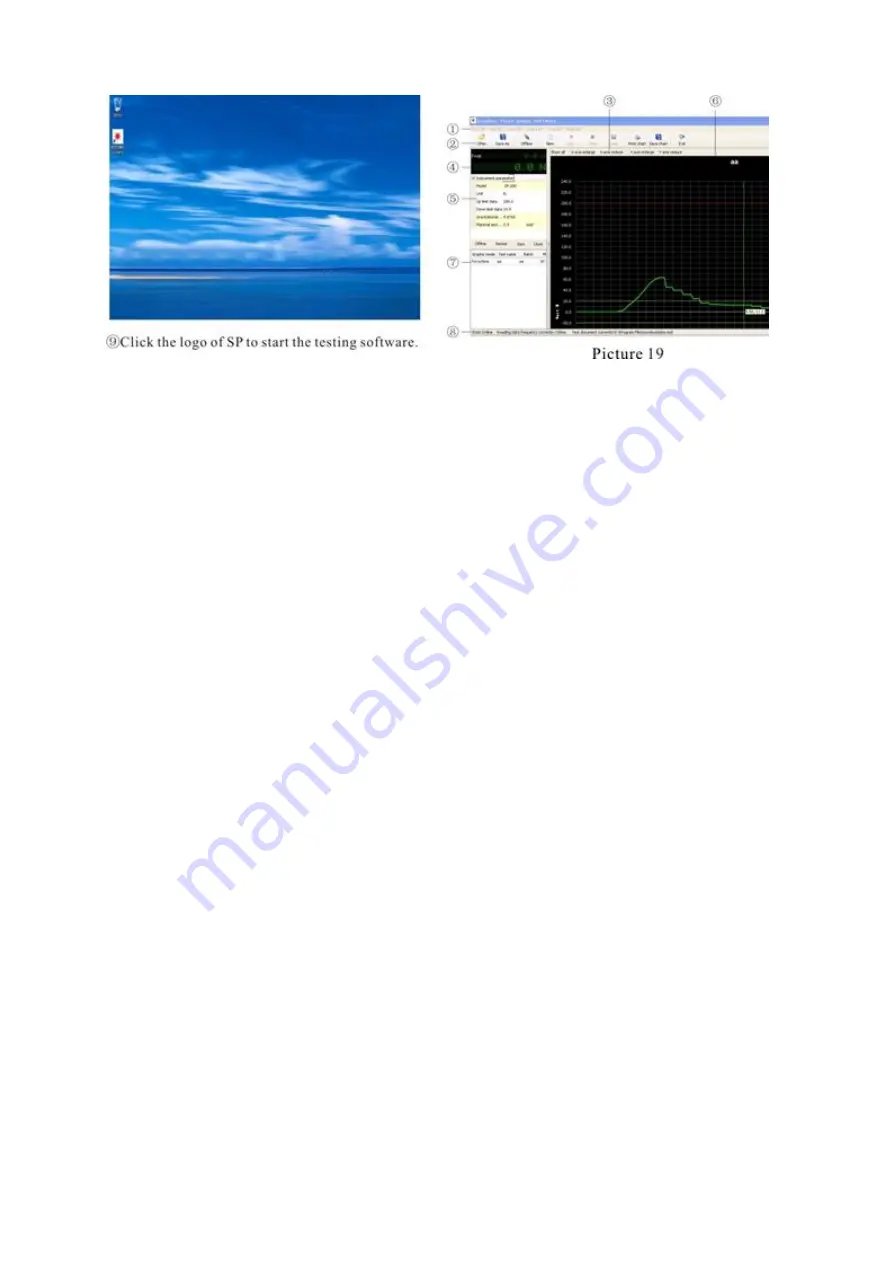
4. Software interface introduction is shown (see pic. 19)
Interface includes 8 parts according to the whole module
(1)
Startup menu bar: all the function menu of software
(2) Function bar: includes the buttons of data base operation, connect operating,
Drew point operating, data save operating and exiting
(3) Diagram function bar: enlarges or shortens coordinate data in drew point part
(4) Real testing data display region: this part will display the current peak value
and testing value by connection the computer only
(5) Gauge parameter region: By connecting the computer, the gauge parameter
will be displayed at this part, such as model/ unit/ upper limit/ lower limit/ gravi-
ty acceleration/ item sectional area and speed and so on. Speed is displayed
under “value/ displace”
(6) Region of curve drew pointing: adapted with FP diagram force gauge, to know
the variation trend of the force value immediately. And the corresponding unit
of coordinates will be converted automatically by choosing different graphic
modes.
(7) Region of data saving: After operating graphic modes, the saved data wil l be
displayed in this region. Saved data includes graphic mode, test title, test
batch, mode, test time, unit, upper or lower limit, acceleration of gravity, detail,
graphic unit, max. value, minimum value, peak value, sectional area and unit,
sectional area speed unit, move and move unit . Some detail value will not be
displayed with different graphic modes, only with specific modes.
(8) Status bar: displaying the information of the connecting status, frequency of
achieving data, route of data base file, program version etc.
5. Function module introduction:
A. Menu command
1) File Menu: File Menu including following commands:
(1) New a test base: create a new data base (see pic. 20)
It will stop when the value on the gauge is bigger than the stop value of the test
stand.


