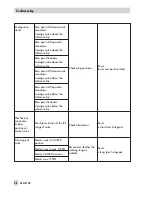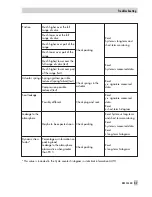
Fig. 13 lists the settings and information pa-
rameters.
While the test is active,
d3
and
tESt
appear
on the positioner display in alternating se-
quence.
indicates manual operating
mode.
Viewing the recorded parameters:
The
Static characteristic
folder contains a
graph of the measured points, plotting the
valve position x versus the reference vari-
able.
The
Measured values
subfolder (>
Valve po-
sition x
) and (>
Reference variable w
) con-
tain a table of the individual corresponding
measured points.
Data can be reset in the
Status messages
folder.
Test requirements:
4
The starting point must be smaller than
the final point.
The dead band is analyzed if the step
height is smaller than 0.2 %.
3.4
Step response (d4)
The dynamic valve performance can be ex-
amined by recording the step responses.
Usually, two steps in reference variable are
performed and the course of the valve posi-
tion x and the drive signal y are plotted until
a steady state is reached. This test is stored
and analyzed in the positioner.
The reference variable w, the setpoint devia-
tion e and time t are also stored and ana-
lyzed.
The default setting is two steps with the first
step usually starting at a defined start value
and ending at a defined end value.
After a certain delay, the second step is per-
formed, starting at the end value of the first
step and ending at the defined start value of
the first step.
The data are automatically analyzed in the
positioner after the test is completed. Param-
eters such as overshoot, dead time, T63,
T98, rise time and settling time are deter-
mined separately for each step.
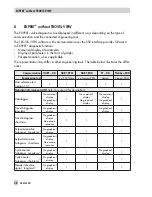
Refer to Fig. 14 for the setting and informa-
tion parameters.
The following analysis parameters are deter-
mined separately for each step:
> Overshoot (relative to the step height) in %
> Dead time
> T63
> T98
> Rise time
> Settling time.
While the test is active,
d4
and
tESt
appear
on the positioner display in alternating se-
quence.
indicates manual operating
mode.
26
EB 8388 EN
Tests MAN


