Doc.-ID: 211007-PT08BA-ES-ExCam XI80_en_rev.00.docx, Page 25 of 28
7.4
User interface
There are many possibilities within the user interface.
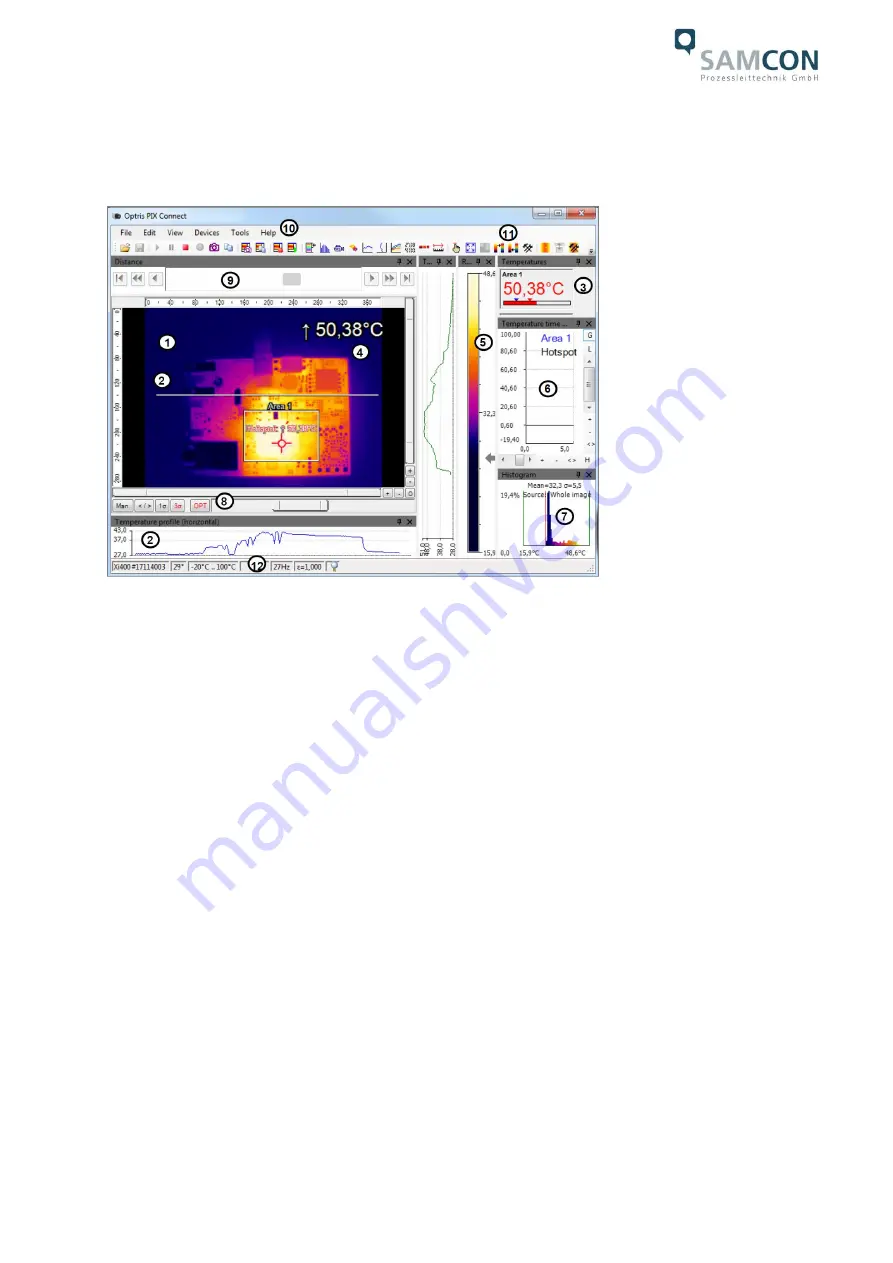
Figure 7-3 User interface
1. IR-Live view from the camera
2. Temperature profile: Temperature distribution on a maximum of two lines, which can
be positioned anywhere in the image in terms of size and position.
3. Digital display group: Possible display of all temperatures from e.g. defined measur-
ing fields, cold spots, hot spots, temperature at the mouse pointer, the internal tem-
perature and the chip temperature. Alarm Settings: Bar with graphical representation
of a defined lower temperature threshold (blue arrow) and an upper threshold (red ar-
row). The color of the digits of the displayed temperature changes to
RED
when the
upper alarm value is exceeded and to
BLUE
when it falls below.
4. Temperature of measure area: Analyses the temperature according to the selected
shape of the field, e.g. the mean value of the rectangle. This value is also shown in
the live image (top right) and in the digital display.
5. Reference bar: Shows a color scale with the corresponding temperature values.
6. Temperature-time diagram: Shows the temperature curve over time for the selected
ROI (region of interest).
7. Histogram: Statistical distribution of individual temperature values in the image.
8. Automatic / manual scaling of the reference bar and thus the displayed temperature
rang
e: Man., </> (min, max), 1 σ: 1 sigma, 3 σ: 3 sigma, OPT: Optimized palette
9. Distance Function: Adjusting the motor focus to focus the image
10. Menu and toolbar (icons)
11. Symbol for switching the individual palette views in the reference bar.
12. Status bar: Serial number, optics, temperature range, mouse cursor position, device
frame rate/display frame rate, emissivity, ambient temperature, flag status
Summary of Contents for ExCam XI80
Page 1: ...ExCam XI80 User Manual...


