16 • Configuration
DETOUR User Guide (v3.0)
To manually add DETOUR to the Tree View in DashBoard
1. In the Basic Tree View toolbar of DashBoard, click
.
The
Select Equipment or Service Type to Add
dialog opens.
2. Expand the
openGear/DashBoard Connect
node.
3. Select
TCP/IP DashBoard Connect or openGear Device
.
4. Click
Next >
.
The
TCP/IP DashBoard Connect/openGear Device
dialog opens.
5. Select the
JSON
radio button as the
Protocol
.
6. In the
IP Address
field, enter the IP Address for the DETOUR that you configured in the procedure “
the initial static IP address for DETOUR
7. Perform one of the following steps:
• In the text fields provided, enter the display name for the DETOUR, and port of the module you wish to add.
• Click
Detect Frame Information
to automatically retrieve the connection details.
8. Click
Finish
.
The DETOUR displays in the Tree View.
Accessing the DETOUR Interfaces in DashBoard
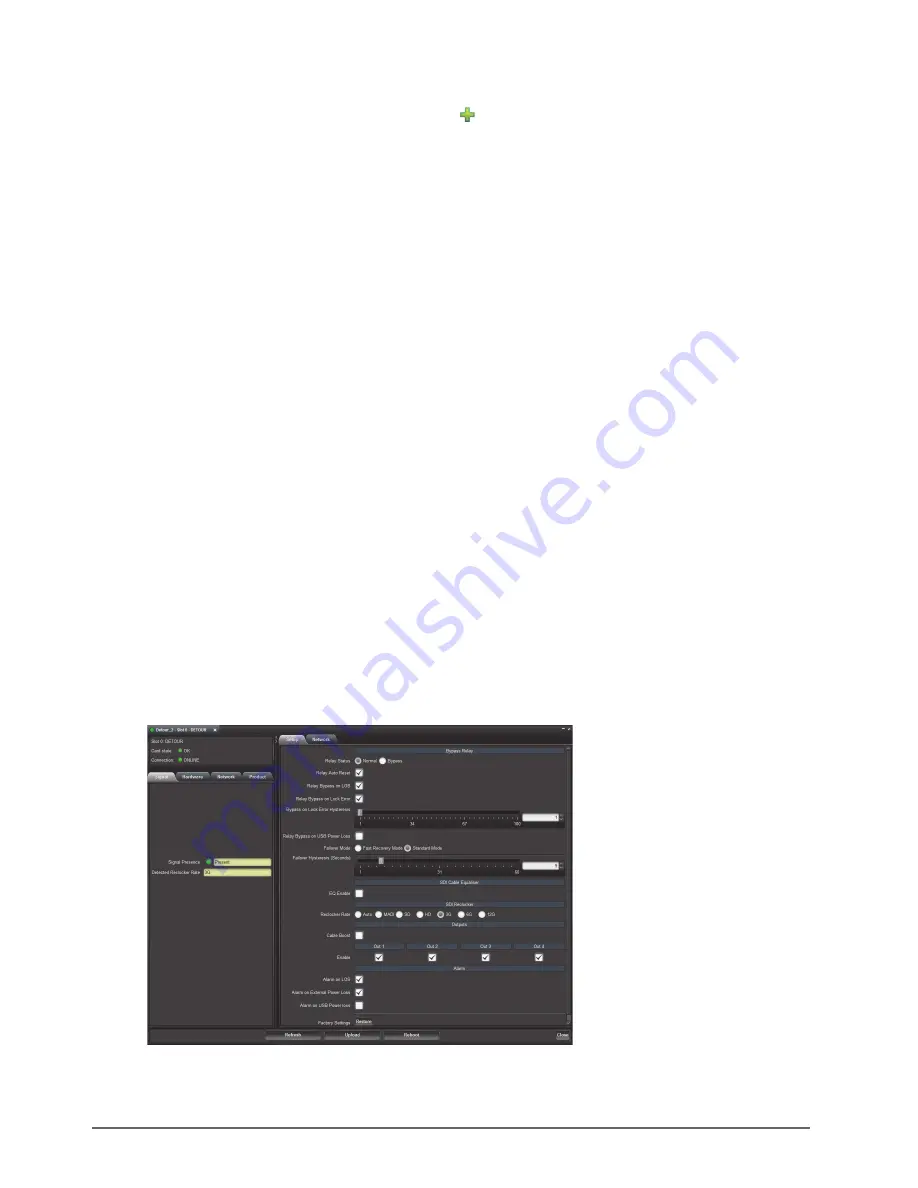
The DETOUR interfaces are accessed by double-clicking the DETOUR node in the DashBoard Tree View and
selecting the appropriate tab in the Device View window. By default, the interfaces (tabs) are organized into status
tabs (on the left), and configuration tabs (on the right).
To access the DETOUR interfaces in DashBoard
1. Locate the DETOUR in the Tree View of DashBoard.
2. Expand the DETOUR node in the Tree View.
3. Double-click the
Slot 0: DETOUR
sub-node to display the tabs in the
Device View
of the DashBoard window.
4. Click a tab to displays its contents.
Summary of Contents for 9201DR-104-03
Page 1: ...DETOUR User Guide...
Page 6: ......
Page 26: ...26 DashBoard Menus DETOUR User Guide v3 0...
Page 28: ...28 Warranty and Repair DETOUR User Guide v3 0...
Page 32: ...32 Technical Specifications DETOUR User Guide v3 0...


