7/14
User
’s Guide
RAGU V1.0 User’s Manual
© 2018 ROHM Co., Ltd.
No. 61UG032E Rev.001
Nov.2018
(01) Operating Mode
-Switch that enables access to
RAGU
(02) Levels
(a) Voltage Level
-Value can be changed by either
the slider or text box.
-To move from one text box to
another, use the enter key.
-The sliders can be configured
using the MAX, STEP and MIN
text boxes.
(b) Frequency Level
-Value can be changed by either
the slider or text box.
-The CLK slider can be
configured using the MAX,
STEP and MIN text boxes.
(03) Computation
-Displays the calculated Io
(04) Clock Output
-Use the
Start
button to enable
or disable the clock output.
-Continuous Mode
: Clock
outputs until the
Stop
button is
clicked.
-Manual Mode
: Clock
generates specified number of
clock cycles.
(05) Pin Voltage Levels
-Use the choices to select the
voltage levels of the
corresponding pins.
Table 3. Main GUI Common Controls
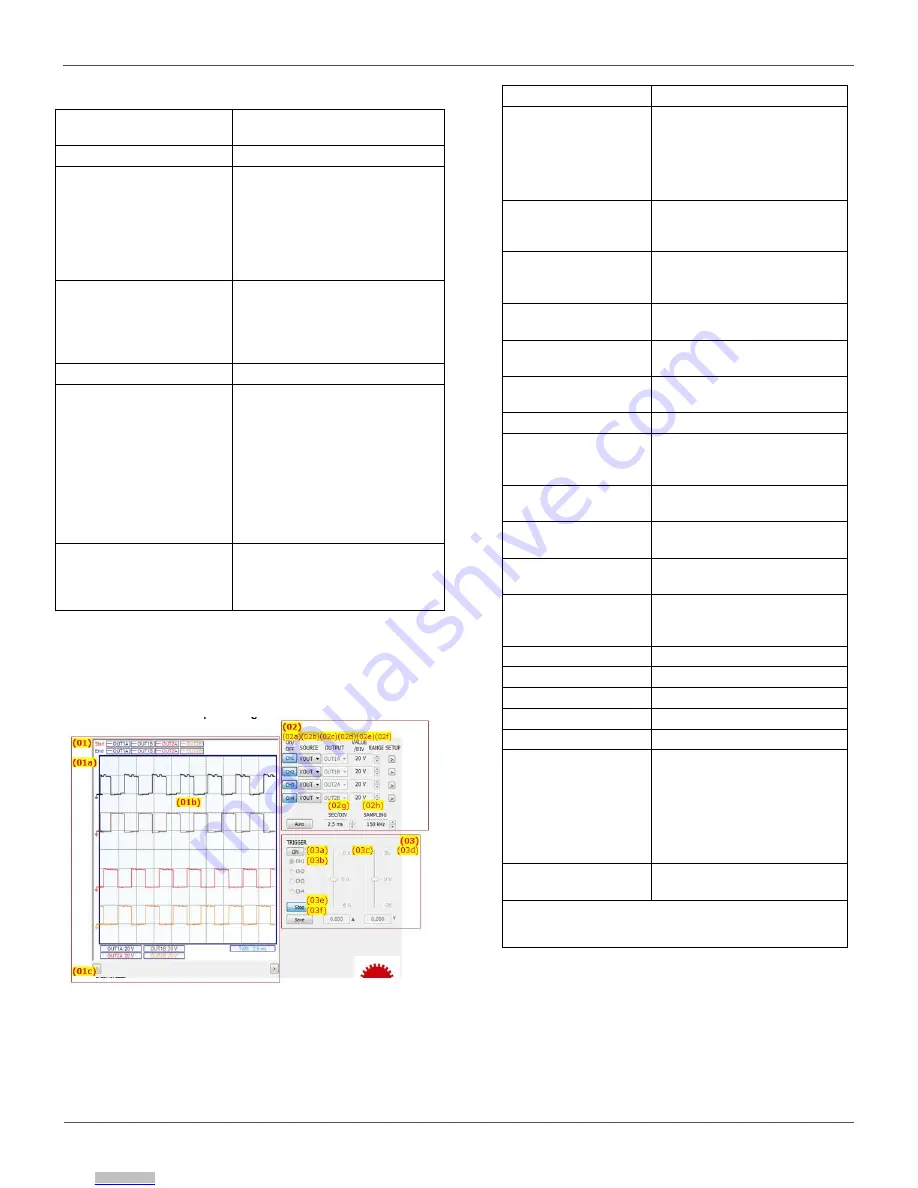
Graph/Plot Area and Oscilloscope Settings
Figure 17. Oscilloscope Settings
(01)Graph/Plot Area
(a) Time-Delta
Measurement
-Use the right double click to
ON/OFF, use right single click
to move the blue cursor. Time
is measured between the red
(left click) and blue (right
click) cursors.
(b) Time-Value
Display
-Use the left double click to
ON/OFF, use left single click
to move the cursor
(c) Horizontal Scroll
-Use the Left and Right Arrow
Buttons to scroll through the
waveform
(02)Channel
Settings
(a) On/Off
-Show/hide the specified
channel
(b) Source
-Select measurement source
(Output Voltage/Current/ICC)
(c) Output
-Channel Select (A/B)
(d) Value/Div
-Display the current or
voltage value/Div of each
channel
(e) Range
-Change the VALUE/Div
Settings
(f) Setup
-Open the Channel Settings
window
(g) Sec/Div
-Control the TIME/Div setting
of the display (in seconds)
(h) Sampling Rate
-Control the sampling
frequency of the Waveform
Scope
(03)Sampling Rate
(a) Trigger
-ON/OFF triggering
(b) Channel
-Select Channel
(c) Current
-Vary current input level
(d) Voltage
-Vary input voltage level
(e) Run/Stop
-Enable/Disable triggering
-Continuously read the 4
channels and plot them in
chart. Only the current
available data in the RAM (8k
samples) will be displayed at
any time.
(f) Save
-Export graph as image
(jpeg.)
Note:
Only one slider is active at any time. The active
slider will depend on the input type (Voltage/Current)
of the currently selected channel.
Table 4. Main GUI Common Controls
Downloaded from
Downloaded from
Downloaded from
Downloaded from
Downloaded from
Downloaded from
Downloaded from


