


34
Rockwell Automation Publication 1441-UM006A-EN-P - May 2011
Chapter 2
Run Up/Coast Down Extension Module
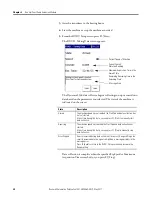
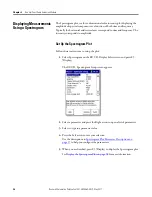
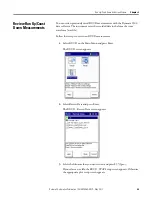
4.
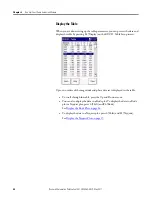
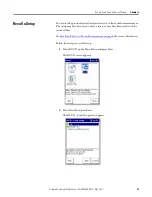
When you are finished and ready to display the waterfall plot, press F3
(Display).
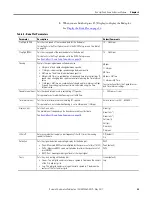
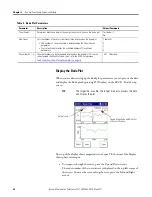
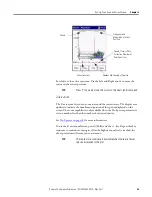
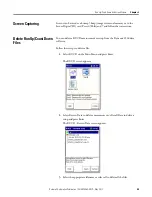
View the Waterfall Plot
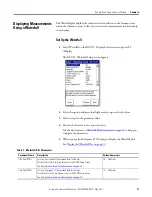
After setting up the Waterfall spectra, press F3 (Display) on the Waterfall Display
Setup screen.
At the bottom of the waterfall plot is a display area that indicates the active
spectrum, and provides information (number of spacing of spectra, speed) on
how the spectra are displayed in the waterfall plot.
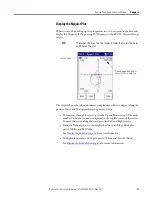
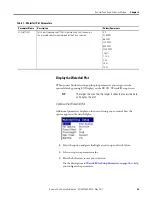
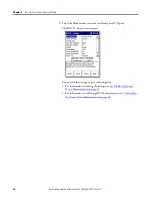
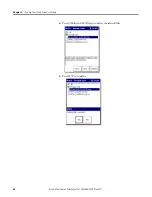
Cursor Movement
Use the Up and Down arrows to sequence through the displayed spectra. The
active spectrum displays in green. The zero positions of the X and Y-axis move to
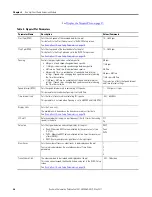
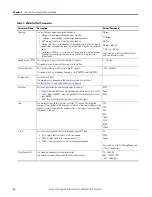
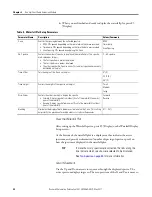
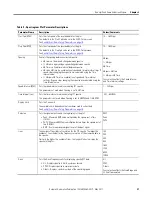
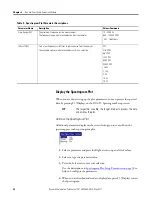
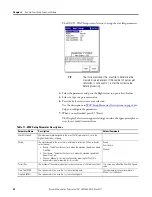
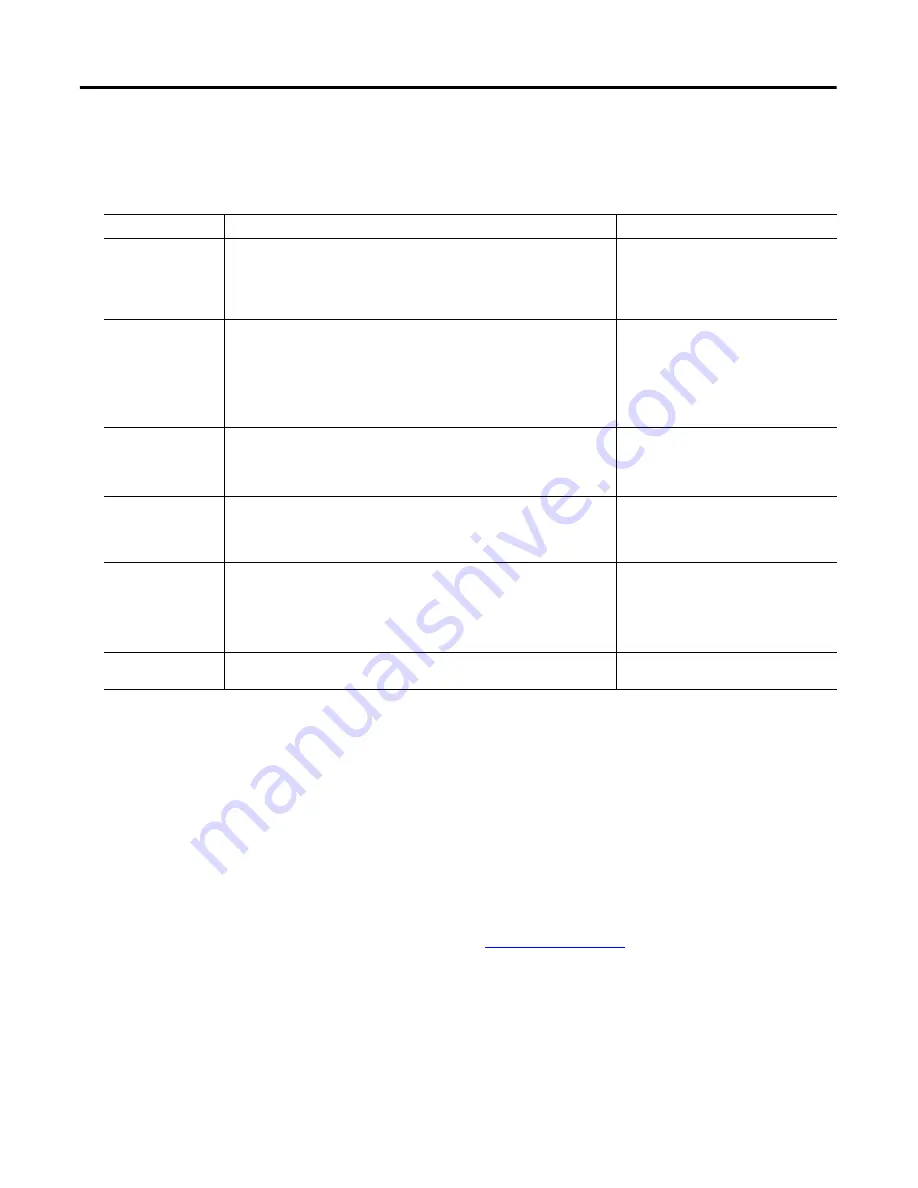
Table 8 - Waterfall Plot Setup Parameters
Parameter Name
Description
Values/Comments
Z-axis
Controls the spacing between the collected spectra.
•
RPM- FFTs spaced depending on the rpm at which they were recorded.
•
Timestamp- FFTs spaced depending on the time the data was recorded.
•
Even Spacing- FFTs spaced evenly along the Z-axis.
RPM
Timestamp
Even Spacing
No. Spectra
Controls the number of spectra to display on the waterfall plot. The spectra
are displayed as follows:
•
The first spectrum is always displayed.
•
The last spectrum is always displayed.
•
The other spectra (No. Spectra minus first and last spectrum) are evenly
distributed on the plot.
2…60 spectra
Trace Offset
Sets the angle of the Z-axis on the plot.
0
°
(C)
22.5
°
(C)
45
°
(C)
Trace Height
Controls the height of the spectra on the plot.
Small
Medium
Large
Disp. Order
Controls the order in which to display the spectra.
•
Forward- Display spectra from oldest (front of the waterfall) to newest
(rear of the waterfall).
•
Reverse- Display spectra from newest (front of the waterfall) to oldest
(rear of the waterfall).
Forward
Reverse
Blanking
Eliminates the display of data below a certain level on the Y-axis. This setting
helps clarify the presence of machine orders or structural frequencies.
0%…25%
TIP
If more than sixty spectra were collected, the ticks along the
line indicate which spectra were selected to be displayed.
for more information.


