36
Rockwell Automation Publication 1441-UM006A-EN-P - May 2011
Chapter 2
Run Up/Coast Down Extension Module
Displaying Measurements
Using a Spectrogram
The Spectrogram plot is a three-dimensional color intensity plot displaying the
amplitude of spectral components as a function of both time and frequency.
Typically the horizontal and vertical axes correspond to time and frequency. The
intensity corresponds to amplitude.
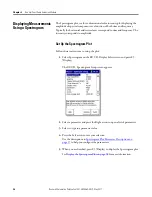
Set Up the Spectrogram Plot
Follow these instructions to setup the plot.
1.
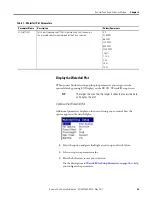
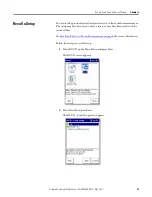
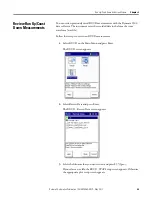
Select Spectrogram
on the RUCD - Display Select screen and press F3
(Display).
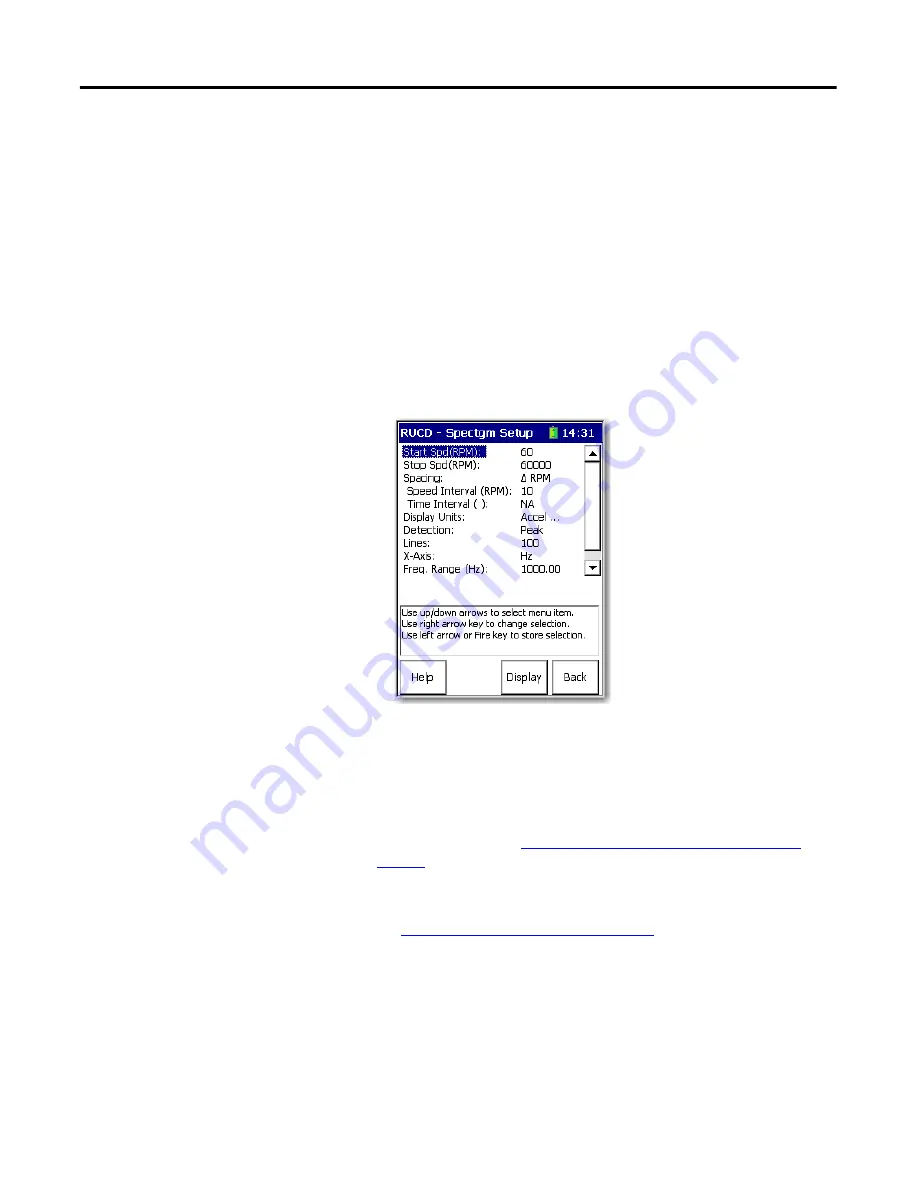
The RUCD - Spectrogram Setup screen appears.
2.
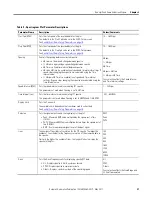
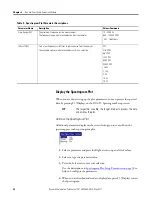
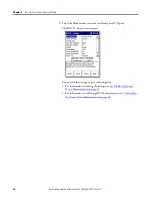
Select a parameter and press the Right arrow to open a list of parameters.
3.
Select to type in a parameter value.
4.
Press the Left arrow to save your selection.
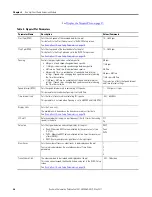
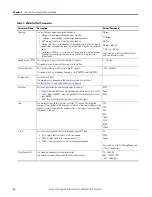
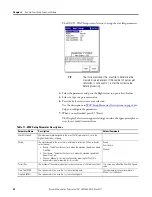
Use the descriptions in
Spectrogram Plot Parameter Descriptions on
to help you configure the parameters.
5.
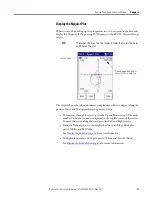
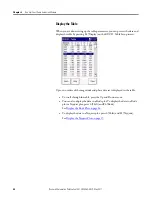
When you are finished, press F3 (Display) to display the Spectrogram plot.
Display the Spectrogram Plot on page 38
for more information.

