Rigol RSA5000 Series User Manual Download Page 107

Chapter 2 Functions of the Front Panel of GPSA


RIGOL


RSA5000 User's Guide


2-63


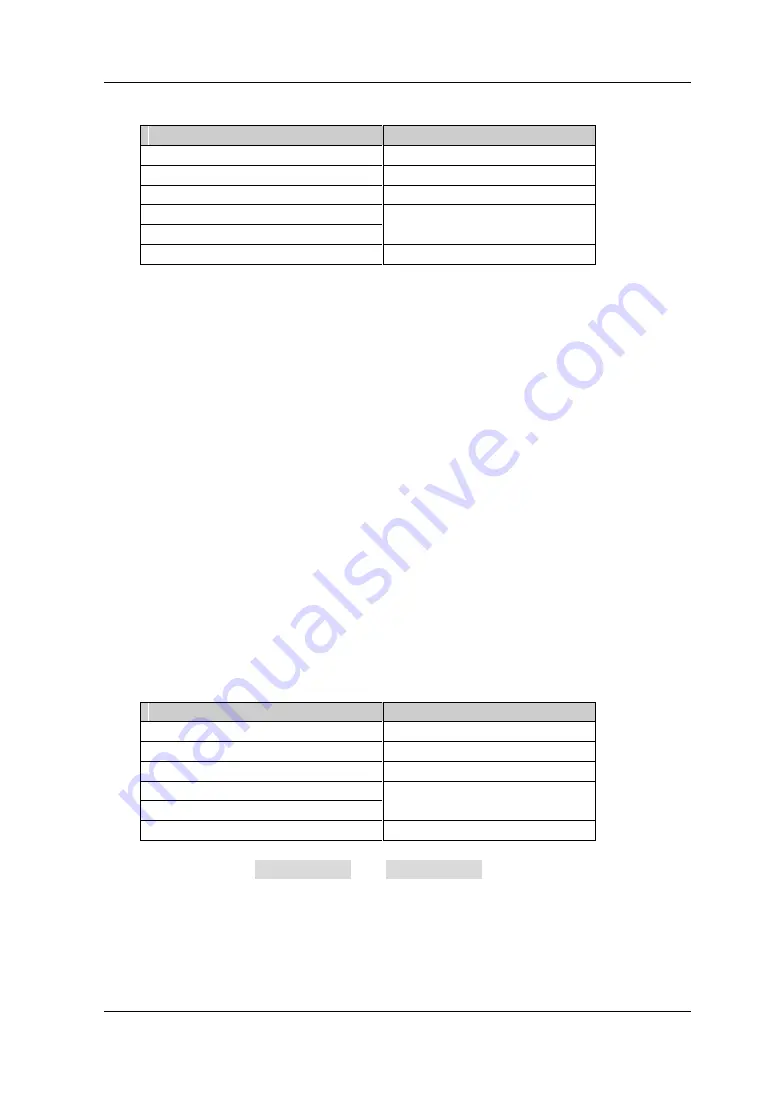
Table 2-51 Average Count for TOI  Measurement 

Parameter 

Remarks 

Default 

10 

Range 

1 to 1,000 

Unit 

None 

Knob Step 

Left/ Right Arrow  Key Step 
Up/ Dow n Arrow  Key Step 


2.  Avg Mode 

Sets the average mode to "Exponential" or "Repeat". The default average mode 
is "Exponential". 


When "Exponential" is selected, the result is the exponential average of the 
measurement results obtained in the past N times (N is specif ied in "

Avg 

Number

"). 


When "Repeat" is selected, the result is the arithmetic average of the 
measurement results obtained in the past N times (N is specif ied in "

Avg 

Number

"). 


3.  Avg State 

Selects whether to averaging the measurement results. By default, it is set to 
"On". 


4.  TOI  Span 

This span is consistent with the span of the spectrum analyzer. I t refers to the 
frequency range of the sweep. After it is set, the span of the spectrum analyzer 
will be modif ied accordingly. You can use the numeric keys, the knob, or arrow 
keys to modify this parameter;  you can also use the touch screen to modify the 
parameter. 


Table 2-52 Span for TOI  Measurement 

Parameter 

Remarks 

Default 

2 MHz 

Range 

10 Hz to 6.5 GHz 

Unit 

GHz, MHz, kHz, Hz 

Knob Step 

TOI  distortion span/ 100, 
Min =  1 Hz 

Left/ Right Arrow  Key Step 
Up/ Dow n Arrow  Key Step 

at 1-1.5-2-3-5-7.5 step 

 
For details about


the 

Auto Couple 

and

 Meas Preset

 menus, refer to their 

descriptions on Page 2-44. 


www.valuetronics.com

Summary of Contents for RSA5000 Series

Page 1: ...RIGOL User s Guide RSA5000 Series Real time Spectrum Analyzer Dec 22 2017 RIGOL TECHNOLOGI ES I NC www valuetronics com ...

Page 2: ...www valuetronics com ...

Page 3: ...publication replaces all previously released materials Information in this publication is subject to change without notice RIGOL shall not be liable for either incidental or consequential losses in connection with the furnishing use or performance of this manual as well as any information contained Any part of this document is forbidden to be copied photocopied or rearranged without prior written ...

Page 4: ... a probe is used the probe ground lead must be connected to earth ground Do not connect the ground lead to high voltage Improper way of connection could result in dangerous voltages being present on the connectors controls or other surfaces of the oscilloscope and probes which will cause potential hazards for operators Observe All Terminal Ratings To avoid fire or shock hazard observe all ratings ...

Page 5: ...strument in a humid environment Do Not Operate in an Explosive Atmosphere To avoid personal injuries or damage to the instrument never operate the instrument in an explosive atmosphere Keep Product Surfaces Clean and Dry To avoid dust or moisture from affecting the performance of the instrument keep the surfaces of the instrument clean and dry Prevent Electrostatic I mpact Operate the instrument i...

Page 6: ...tant data Safety Terms on the Product DANGER It calls attention to an operation if not correctly performed could result in injury or hazard immediately WARNI NG It calls attention to an operation if not correctly performed could result in potential injury or hazard CAUTI ON It calls attention to an operation if not correctly performed could result in damage to the product or other devices connecte...

Page 7: ...quids WARNI NG To avoid short circuit resulting from moisture or personal injuries ensure that the instrument is completely dry before connecting it to the power supply Environmental Considerations The following symbol indicates that this product complies with the WEEE Directive 2002 96 EC Product End of Life Handling The equipment may contain substances that could be harmful to the environment or...

Page 8: ...ed in education science corporate R D industrial production and other fields Main Features Ultra Real technology Frequency up to 6 5 GHz Displayed average noise level DANL 165 dBm typical Phase noise 108 dBc Hz typical Level measurement uncertainty 0 8 dB 6 5 GHz tracking generator Min RBW 1 Hz EMC filter and quasi peak detector Various measurement functions Multiple measurement modes Up to 40 MHz...

Page 9: ...nel keys Chapter 4 I nput Output This chapter introduces the parameter settings for the input output interface Chapter 5 Shortcut Key This chapter introduces the functions of the shortcut keys on the front panel Chapter 6 System Function This chapter introduces the system function settings Chapter 7 Remote Control This chapter shows how to control the analyzer in remote mode Chapter 8 Troubleshoot...

Page 10: ...e Brackets Bold For example Gen Output 50Ω 4 Operation Procedures represents the next step of operation For example FREQ Center Freq indicates pressing FREQ on the front panel and then pressing the menu softkey Center Freq Content Conventions in this Manual The RSA5000 series spectrum analyzer includes the following models This manual takes RSA5065 TG as an example Model Frequency Range Tracking G...

Page 11: ...ion 1 5 To Set the System Language 1 6 Front Panel 1 7 Function Keys on the Front Panel 1 8 Utility Function Keys on the Front Panel 1 10 Front Panel Key Backlight 1 11 Front Panel Connector 1 12 To Use the Numeric Keypad 1 14 Rear Panel 1 16 User Interface 1 18 Mouse Keyboard Touch Screen Operation Rule 1 20 Mouse Operation Rule 1 20 Keyboard Operation Rule 1 21 Touch Screen Operation Rule 1 22 M...

Page 12: ...hapter 3 Functions of the Front Panel of RTSA 3 1 Basic Settings 3 2 FREQ 3 2 SPAN 3 2 AMPT 3 5 Sweep and Function Settings 3 6 BW 3 6 Sweep 3 8 Trigger 3 10 Trace 3 15 Measurement Settings 3 17 Meas 3 17 Meas Setup 3 25 Marker Setup 3 32 Marker 3 32 Marker To 3 32 Marker Function 3 32 Peak 3 32 Chapter 4 I nput Output 4 1 Chapter 5 Shortcut Key 5 1 Auto Tune 5 1 Preset 5 3 User 5 9 Quick Save 5 9...

Page 13: ...pter 7 Remote Control 7 1 Remote Control Overview 7 2 Remote Control via USB 7 3 Remote Control via LAN 7 4 Chapter 8 Troubleshooting 8 1 Chapter 9 Appendix 9 1 Appendix A RSA5000 Accessories and Option List 9 1 Appendix B Warranty 9 2 I ndex 1 www valuetronics com ...

Page 14: ...www valuetronics com ...

Page 15: ...ront and rear panel user interface as well as announcements during first use of the analyzer Contents in this chapter General Inspection Appearance and Dimensions To Prepare for Use Front Panel Rear Panel User Interface Mouse Keyboard Touch Screen Operation Rule Menu Operation Parameter Setting To Use the Built in Help System Fuse Replacement Mode Setting www valuetronics com ...

Page 16: ...l be liable for the damage to the instrument resulting from shipment RIGOL would not be responsible for free maintenance rework or replacement of the instrument 2 I nspect the instrument In case of any mechanical damage missing parts or failure in passing the electrical and mechanical tests contact your RIGOL sales representative 3 Check the accessories Please check the accessories according to th...

Page 17: ...Chapter 1 Quick Start RIGOL RSA5000 User s Guide 1 3 Appearance and Dimensions Figure 1 1 Front View Unit mm Figure 1 2 Vertical View Unit mm www valuetronics com ...

Page 18: ...porting legs to use them as stands to tilt the instrument upwards for easier operation and observation You can also fold the supporting legs for easier storage or shipment when the instrument is not in use Figure 1 3 To Adjust the Supporting Legs To unfold the supporting legs To fold the supporting legs www valuetronics com ...

Page 19: ...ge and you do not need to select the voltage range manually CAUTI ON To avoid electric shock ensure that the instrument is correctly grounded Turn on Checkout After connecting the instrument to the power source properly press the Power key on the front panel to start the spectrum analyzer Then you will see an initial splash screen Following the start up screen which shows the start up initializati...

Page 20: ... 1 Quick Start 1 6 RSA5000 User s Guide To Set the System Language RSA5000 series spectrum analyzer supports multiple system languages You can press System Language to switch the system language www valuetronics com ...

Page 21: ... Description 1 LCD 9 Numeric keypad 2 Menu softkeys 10 Tracking generator output 1 3 Back to previous menu item 11 Utility function key area 4 Function key area 12 Page up down key 5 Help key 13 Speaker 6 Knob 14 Earphone jack 7 Arrow keys 15 USB HOST 8 RF input 16 Power key Note 1 This function is only available for RSA5065 TG RSA5032 TG 1 2 3 16 15 14 13 12 11 10 9 8 5 6 7 4 www valuetronics com...

Page 22: ...sweep Sets the parameters such as reference level RF attenuator scale and Y axis unit Enables preamp Sets the parameters such as resolution bandwidth RBW and video bandwidth VBW Sets the parameters such as input impedance external gain and External Trigger 2 Selects the RF calibration signal Reads the amplitude and frequency of a certain point on the trace via marker Opens the peak search menu and...

Page 23: ...ing mode of the spectrum analyzer Sets the parameters for the selected working mode Selects and controls the measurement function 2 Sets the parameters 2 for the selected measurement function Searches for signals automatically within full frequency range Restores the system to factory settings or user defined state Sets the system parameters Recalls the files Manages the files Saves the files User...

Page 24: ...u can operate the instrument with the function keypad Utility Function Keys on the Front Panel Table 1 3 Descriptions of Utility Function Keys on the Front Panel Locks all the keys except the Power key on the front panel Locks the touch screen of the instrument In the multi window display mode press this key to select the specified window to zoom it in or out In the multi window display mode press...

Page 25: ... amplitude and moves it to the center of the screen After the sweep is completed the backlight turns off 3 Tracking Generator Option When the tracking generator function is enabled the TG key is illuminated when disabled the backlight of the TG key is off 4 Single When the Single key is illuminated it indicates that the sweep measurement mode is single 5 Keypad Locking Key When the backlight is on...

Page 26: ...mit line or FMT to the USB storage device or stores the contents currently displayed on the screen to the USB storage device in jpg bmp or png format Mouse After the mouse is properly connected to the instrument you can use it to click on the screen to perform parameter setting and function configuration For details refer to descriptions in Mouse Keyboard Touch Screen Operation Rule Keyboard After...

Page 27: ...SA5065 TG RSA5032 TG CAUTI ON To avoid damage to the tracking generator the reverse power cannot exceed 10 dBm when the frequency is lower than 10 MHz the reverse power cannot exceed 20 dBm when the frequency is greater than 10 MHz The reverse DC voltage should not exceed 50 V 4 RF Input 50Ω The input terminal of the signal under test RF Input 50Ω can be connected to the device under test DUT via ...

Page 28: ...ng Figure 1 7 Numeric Keypad The numeric keypad consists of the following parts 1 Number Letter Multiplexing keys for numbers and letters They are used to directly input the desired number or letter press this key to input 1 in number input to switch between uppercase and lowercase letter in English input This key is invalid in Chinese input is the multiplexing key for 0 and space Press this key t...

Page 29: ...this key to exit parameter input When you edit the filename with the on screen keyboard press this key to hide the on screen keyboard In multi touch test single touch test and keyboard test state press this key to exit the current test state When the instrument is in remote mode press this key to return to the local mode 5 When editing the parameter press this key to delete the character to the le...

Page 30: ... stable frequency reference over temperature variations For order information of the option refer to the datasheet manual Note A 40 minute warm up is required for OCXO to reach its nominal frequency 4 Handle You can rotate the handle upright and make the portable instrument easy to carry 5 10MHz I N RSA5000 can use the internal or external reference source When a 10 MHz external clock signal is re...

Page 31: ... Output Ext Trigger2 to set it to be the external trigger input interface or use it to synchronize the trigger output interfaces of other test devices 8 TRI GGER I N Indicates the input terminal of Ext Trigger1 The Ext Trigger1 signal is sent to the spectrum analyzer through a BNC cable 9 LAN Through this interface the analyzer can be connected to your local network for remote control An integrate...

Page 32: ...asurement result Displays the current measurement results for the marker when no marker exists the measurement results display frequency span value 3 RIGOL Indicates the company logo 4 System status Rmt indicates remote operation Ext indicates the external reference Uncal indicates that the measurement has not be calibrated PA on indicates that the preamp has been enabled TG on indicates that the ...

Page 33: ...rface 11 Active function area Displays the current parameter and its value 12 Time Displays the system time 13 Menu title Displays the currently selected menu name 14 Menu item Displays the menu item of the current function 15 Menu page Shows the current page and the total number of pages for the menu 16 Sweep time and points Indicates the sweep time and the number of sweep points in swept mode 17...

Page 34: ... only available for GPSA V Voltage Average only available for GPSA P Positive Peak p Negative Peak S Sample R RMS Average only available for GPSA Q Quasi Peak only available for GPSA and A Average only available for RTSA If it shows f it indicates that it is math operation trace The letter in blue in the third line detector type indicates that the detector is in auto state the letter in white indi...

Page 35: ...ard Shortcut Key 1 Mode Alt o Mode Setup 2 Shift o Meas Alt e Meas Setup 2 Shift e Auto Tune Ctrl Alt a Preset Ctrl Alt p FREQ 2 Shift f SPAN 2 Shift s AMPT 2 Shift a BW 2 Shift b Trace 2 Shift t Sweep 2 Shift w Input Output 2 Shift i TG 2 Shift g Cont F11 Marker 2 Shift m Marker 2 Shift k Single F12 Peak 2 Shift p Marker Func 2 Shift u Trigger 2 Shift r System 2 Shift y File Ctrl f User Ctrl u Re...

Page 36: ...he Shift f shortcut key operation you only need to press f on the premise that the Caps Lock key is enabled Touch Screen Operation Rule RSA5000 has a 10 1 inch capacitive multi touch screen that supports touch gestures 1 When operating on the menus other than the Marker menu Tap the trace window then slide left and right to modify the center frequency slide up and down to modify the reference leve...

Page 37: ...ignal tracking function Press the corresponding menu key to enter the lower level menu and change the currently selected option The parameter type in the upper level menu will be changed when you return to the upper level menu again For example press Y Axis Unit to enter the lower level menu Select dBm and then automatically return to the previous menu automatically Then the unit of Y axis will be...

Page 38: ...uted by touch gestures or clicking with the externally connected mouse Also you can connect to the keyboard and use the shortcut keys to perform the above menu operations For the matching relations between the front panel keys and the keyboard shortcut keys refer to Table 1 5 www valuetronics com ...

Page 39: ...clockwise to increase or counterclockwise to decrease the parameter value at the specified step 1 Press FREQ Center Freq 2 Rotate the knob until the parameter is set to the desired value 800 MHz Figure 1 10 Knob 3 Use the arrow keys When the parameter is editable use the arrow keys to increase or decrease the parameter value at the specific step Note that the step sizes for the Up Down arrow key a...

Page 40: ...ic keys 4 Press F2 to select the desired unit MHz from the pop up menu For the matching relations between the front panel keys and the keyboard shortcut keys refer to Table 1 5 6 Use the mouse 1 Click with the mouse to select the function keypad icon at the upper right corner of the screen Then the function keypad is displayed Click FREQ 2 Click Center Freq 3 Then the numeric keypad is displayed I...

Page 41: ...on 3 Close the current help information Press any key on the front panel to close the help information currently displayed on the screen When the help information is displayed on the screen perform any of the following operations to close the currently displayed help information dialog box press Esc press the Help key again or click OK in the displayed help information dialog box 4 Get the help in...

Page 42: ...remove the power cord 2 Use a small straight slotted screwdriver to pry out the fuse holder 3 Take out the fuse holder 4 Replace the old fuse with a specified fuse 5 Install the fuse holder Figure 1 12 To Replace the Fuse WARNI NG To avoid electric shock please ensure that the instrument has been turned off the power source has been cut off and the fuse to be used conforms to the fuse rating Fuse ...

Page 43: ...irst Then select the desired working mode and obtain the corresponding help information 1 GPSA GPSA adopts two analysis methods swept and FFT GPSA can not only carry out frequency domain analysis but also time domain zero span analysis Select GPSA In this working mode press Meas to select multiple measurements For details refer to Chapter 2 2 RTSA RTSA provides the analysis function for the real t...

Page 44: ...cy In any working mode if you enable the global center frequency then the global center frequency will be set to the center frequency of the current mode When you switch to a different working mode the global center frequency will be set to the center frequency of its previous working mode If you change the center frequency in any working mode then the global center frequency will change with it 2...

Page 45: ...hapter 2 Functions of the Front Panel of GPSA This chapter describes in detail the function keys on the front panel and their associated menu functions Contents in this chapter Basic Settings Sweep and Function Settings Measurement Settings Marker Measurement www valuetronics com ...

Page 46: ... frequency parameters are modified The frequency range of a channel can be expressed by either of two groups of parameters Start Frequency Stop Frequency start f stop f or Center Frequency Span center f span f If any of the four parameters is changed the other three parameters will make adjustment automatically to ensure the coupling relationship among them 2 start stop center f f f 2 1 start stop...

Page 47: ...in the frequency range specified in the technical specifications of the analyzer In zero span mode the values of start frequency stop frequency and center frequency are the same so once one of the parameter values is modified the other two values will be modified automatically You can use the numeric keys the knob and the arrow keys on the front panel to modify this parameter also you can modify i...

Page 48: ...ting Table 2 2 Start Frequency Parameter Remarks Default center frequency span 2 Range 1 0 Hz to Fmax Unit GHz MHz kHz Hz Knob Step span 0 step span 200 span 0 step RBW 100 Min 1 Hz Left Right Arrow Key Step Up Down Arrow Key Step CF step Note 1 The range is from 0 Hz to Fmax 10 Hz in non zero span Stop Freq Sets the stop frequency of the current frequency channel Press this key or touch the speci...

Page 49: ...t step size value switches the channel to be measured continuously Remarks Set a proper CF step value and then select the center frequency Use the Up Down arrow key to switch the measurement channel at a fixed step size Thus the instrument can sweep the adjacent channels manually You can use the numeric keys the knob and the arrow keys on the front panel to modify this parameter also you can modif...

Page 50: ...can use the numeric keys the knob and the arrow keys on the front panel to modify this parameter also you can modify it on the touchscreen For details refer to descriptions in Parameter Setting To eliminate the frequency offset you can set the frequency offset to 0 Hz Table 2 5 Frequency Offset Parameter Remarks Default 0 Hz Range 500 GHz to 500 GHz Unit GHz MHz kHz Hz Knob Step span 0 step full s...

Page 51: ...ency to keep the signal at the center of the screen If no marker is currently active when Signal Track is enabled the instrument will activate Marker1 execute a peak search automatically and set the frequency value at the current peak to be the center frequency to keep the signal always displayed at the center of the screen In continuous sweep the system tracks the signal continuously in single sw...

Page 52: ... span mode You can set the span to 0 Hz manually you can press the Zero Span menu item or run the SCPI commands to enter the zero span mode When you modify the span in non zero span mode both CF step and RBW will be changed automatically if they are in Auto mode Besides the change of RBW will change the value of VBW in Auto VBW mode Any variation in span RBW or VBW would cause a change in the swee...

Page 53: ... FREQ Mkr CF Mkr CF Step Mkr Start Mkr Stop Mkr Δ CF and Mkr Δ Span under Marker To AMPT Sets the amplitude parameters of the analyzer You can modify these parameters to make the signals under test be displayed with minimal errors in the current window easy for you to observe Ref Level Sets the maximum power or voltage that can be displayed in the current window Remarks As the RF link is limited b...

Page 54: ...0 dB to 30 dB Therefore the input attenuation ranges from 0 dB to 50 dB When the set attenuation amount is greater than 20 dB fixed attenuator is preferred to be used by default When the maximum mixer level and reference level are confirmed the minimum of the input attenuation should meet the following equation mix Offset Ext PA Ref min L L a a L ATT 2 3 Wherein min ATT Ref L PA a Ext a Offset L a...

Page 55: ...ets the RF front end preamplifier to be on or off When the signal under test is a low level signal turning on the preamplifier can reduce the displayed average noise level so that you can distinguish low level signals from the noise By default the preamp gain is 20 dB Y Axis Unit Sets the unit of the Y axis to dBm dBmV dBuV Volts or Watts Wherein dBm dBmV and dBuV are for Log scale Volts and Watts...

Page 56: ...automatically switch to the default unit Volts in Lin scale type The scale type does not affect the unit of Y axis If the Normalize function is enabled Log is selected to be the scale type by default and the scale type is grayed out and disabled Scale Div Sets the logarithmic units per vertical grid division on the display This function is only available when the scale type is set to Log Remarks T...

Page 57: ...Table 2 10 Maximum Mixing Level Parameter Remarks Default 10 dBm Range 50 dBm to 10 dBm Unit dBm dBm mV uV Knob Step 1 dBm Left Right Arrow Key Step Up Down Arrow Key Step 5 dBm Ref Offset Adds an offset value to the reference level to compensate for gains or losses generated between the DUT and the analyzer input Remarks The offset value does not affect the trace position but will modify the refe...

Page 58: ...screen For details refer to descriptions in Parameter Setting Note When Detector Type is Quasi Peak or the Filter Type is EMC the available values of RBW can only be 200 Hz 9 kHz 120 kHz or 1 MHz Table 2 12 RBW Parameter Remarks Default 10 MHz Range 1 Hz to 10 MHz Unit GHz MHz kHz Hz Knob Step at 1 3 10 step Left Right Arrow Key Step Up Down Arrow Key Step at 1 3 10 step RBW Mode Sets the coupling...

Page 59: ...rameter Remarks Default 106 Range 2 to 10 000 Unit None Knob Step at 1 2 5 step Left Right Arrow Key Step Up Down Arrow Key Step at 1 2 5 step SPAN RBW Mode Sets the coupling mode of the Span RBW ratio Remarks When you set SPAN RBW Mode to Auto SPAN RBW Ratio is in auto coupling state and its value is 106 You can set SPAN RBW Mode to Manual or directly set the SPAN RBW ratio to change the coupling...

Page 60: ...eft Right Arrow Key Step Up Down Arrow Key Step at 1 3 10 step VBW Mode Sets the coupling mode of the Span RBW ratio Remarks When you set VBW Mode to Auto VBW is in auto coupling state Its value changes with the RBW and the value is determined by VBW RBW ratio You can set VBW Mode to Manual or directly set the VBW value to change the coupling mode When you perform the Preset operation the coupling...

Page 61: ...state and its value is determined by auto rule value You can set VBW RBW Mode to Manual or directly set the VBW RBW ratio to change the coupling mode When you perform the Preset operation the coupling state is Auto Filter Type Sets the type of the RBW filter Remarks RSA5000 supports two kinds of RBW filters Gaussian 3 dB or EMC 6 dB When EMC filter is selected currently the available RBW can only ...

Page 62: ...new sweep and measurement again You can use the numeric keys the knob and the arrow keys on the front panel to modify this parameter also you can modify it on the touchscreen For details refer to descriptions in Parameter Setting Table 2 16 Number of Sweep Points Parameter Remarks Default 801 Range 101 to 10 001 Unit None Knob Step 1 Left Right Arrow Key Step Up Down Arrow Key Step 5 Sweep Time Se...

Page 63: ... zero span mode the Sweep Time Mode menu is disabled and grayed out When the system exits the zero span mode the auto sweep coupling mode will restore to its previous state When RBW is smaller than 1 kHz the spectrum analyzer starts to perform FFT sweeps At this time the Sweep Time menu is disabled and grayed out Sweep Time Rule Sets the sweep type to Norm or Accy The sweep will be faster if Norm ...

Page 64: ...ement Remarks If the instrument is in continuous sweep mode and no measurement function is enabled press this key to enter single sweep mode In this case if the trigger conditions are met the instrument will execute the specified number of sweeps Note In Average Max Hold and Min Hold modes when performing the single measurement the instrument will not stop sweeping until the sweep count has reache...

Page 65: ...nditions Press Single Measurement status Single sweep mode Single sweep mode Enter single sweep mode and wait for trigger condition Enter single sweep measurement mode and wait for trigger condition Sweep again and wait for trigger condition Wait for trigger condition and make single measurement again N N N Y Y Y Figure 2 3 Process of Single Sweep www valuetronics com ...

Page 66: ...he TRI GGER I N OUT connector on the rear panel When the signal meets the set trigger conditions trigger signals are generated Note For the external trigger interface the input signal frequency shall not exceed 1 MHz 4 Video A trigger signal will be generated when the system detects a video signal whose voltage exceeds the specified video trigger level Note This trigger type is available in either...

Page 67: ...at 1 1 5 2 3 5 7 5 step Trigger Level Sets the trigger level in video trigger At this time the trigger level line and the trigger level value are displayed on the screen Remarks When the video trigger signal is not within the display range the trigger level line is displayed at the top or bottom of the waveform display area You can use the numeric keys the knob and the arrow keys on the front pane...

Page 68: ... Trigger Holdoff Time Parameter Remarks Default 100 ms Range 100 μs to 500 ms Unit s ms μs ns ps Knob Step sync holdoff time 100 Min 1 μs Left Right Arrow Key Step Up Down Arrow Key Step at 1 1 5 2 3 5 7 5 step Auto Trig Switch Enables or disables the auto trigger function Auto Trig Sets the time that the instrument will wait for the trigger conditions to be met When the set waiting time times out...

Page 69: ...5 trigger signal triggers on the rising edge trigger delay trigger occurs trig holdoff auto trig trigger occurs trigger delay sweep measurement1 sweep measurement2 turn off trigger delay trigger occurs trigger occurs Figure 2 4 Trigger Parameter Relationship www valuetronics com ...

Page 70: ...currently selected trace The system calculates the sampled data by a specific operation method according to the selected trace type The results will not be displayed unless you set Trace Update and Trace Display to On Trace types include Clear Write Average Max Hold and Min Hold 1 Clear Write Sets the trace data to a minimum value and displays the real time sweep data of each point on the trace 2 ...

Page 71: ...mum value of the sample data is displayed In this way the amplitude variation range of the signal is clearly shown 4 Sample For each trace point sample detector displays the transient level corresponding to the central time point of the corresponding time interval This detector type is applicable to noise or noise like signal 5 Average RMS For each data point perform mean square root operation see...

Page 72: ...r the quasi detector is much shorter than the discharge time which can not only reflects the amplitude of the signal but also the time distribution of the signal Detector Auto Enables or disables the Detector Auto function By default Detector Auto is enabled If you set the detector type manually please disable the Detector Auto function Trace Update Enables or disables trace update Trace Display E...

Page 73: ... is dB If a point in Op1 is a maximum trace value the difference the result of the subtraction is also a maximum trace value if the difference is less than or equal to 0 the resultant point is the minimum trace value 2 Op1 Op2 Calculates the power sum between Operand 1 Op1 and Operand 2 Op2 and saves it to the destination trace During the sweep the following formula is executed for each point 10 1...

Page 74: ...trace math functions are mutually exclusive If you apply one math operation to a certain trace the last selected math operation function should be disabled Op1 Selects Operand 1 to be used for the trace math functions Operand 2 can be configured with Trace1 Trace2 Trace3 Trace4 Trace5 or Trace6 Op2 Selects Operand 2 to be used for the trace math functions Operand 2 can be configured with Trace1 Tr...

Page 75: ...meter Remarks Default 0 dB Range 170 dB to 30 dB Unit dB Knob Step 1 dB Left Right Arrow Key Step Up Down Arrow Key Step 5 dB Preset All Turns on Trace 1 and blanks all other traces This operation does not affect the trace type trace detector and other states Clear All Clears all traces All the trace data will be set to the minimum trace value except the case that the trace is in Min Hold state Wh...

Page 76: ...uchscreen For details refer to descriptions in Parameter Setting Table 2 24 Tracking Generator Output Signal Amplitude Parameter Remarks Default 40 dBm Range 40 dBm to 0 dBm Unit dBm dBm mV uV Knob Step 1 dBm Left Right Arrow Key Step Up Down Arrow Key Step 10 dBm Amplitude Offset Sets the offset of the output power of the tracking generator when gains or losses occur between the TG output and ext...

Page 77: ...er will save the reference trace automatically after it completes the current sweep During saving the reference trace a prompt message will be displayed When the normalize function is enabled the corresponding value of the reference trace will be subtracted from the trace data after every sweep 2 Reference Level After the normalize function is enabled you can adjust the vertical position of the tr...

Page 78: ...ric keys the knob and the arrow keys on the front panel to modify this parameter also you can modify it on the touchscreen For details refer to descriptions in Parameter Setting Table 2 27 Tracking Generator Reference Position Parameter Remarks Default 100 Range 0 to 100 Unit Knob Step 1 Left Right Arrow Key Step Up Down Arrow Key Step 10 4 Reference Trace Sets whether to display the reference tra...

Page 79: ...o windows with the upper window the basic measurement window displaying the sweep trace and the lower window displaying the measurement results 1 Meas Off Disables the advance measurement function and returns to the swept SA interface in GPSA mode 2 T Power The system enters the zero span mode and calculates the power within the time domain The available power types include Peak Average and RMS Se...

Page 80: ...as Setup to set the corresponding parameters 7 C N Ratio Measures the power of the carrier and that of the noise with the specified bandwidth as well as their power ratio Select C N Ratio and then press Meas Setup to set the corresponding parameters 8 Harmo Dist Measures the power of each order of harmonic and THD total harmonic distortion of the carrier The highest order of harmonics for measurem...

Page 81: ...izard At this time you can perform the VSWR measurement according to the wizard Press Meas Setup to set the corresponding parameters Tip The VSWR bridge and tracking generator are required in VSWR measurement Therefore this function is only available for the instrument installed with VSWR bridge and the tracking generator option When the VSWR measurement is enabled the tracking generator is enable...

Page 82: ...and averaging processes select the log unit dB This average type is the most effective one for finding the low level signal that is close to the noise amplitude The formula is shown as follow k Newdata OldAvg 1 k NewAvg 2 15 In the above formula the parameter unit is dB RMS In this mode all filtering and averaging processes work on the power the square of the amplitude of the signal This average t...

Page 83: ...he trace to indicate whether the test passes or fails 2 Select Limit Selects the current limit line By default it is Limit1 3 Limit State Enables or disables the display of the limit line When the limit line is on the measurement interface displays the limit line and the corresponding traces are tested based on the current limit lines Each limit line is displayed in a different color 4 Edit Limit ...

Page 84: ...amplitude of the current point If the Rel Ampt is enabled edit the amplitude difference between the amplitude of the current point and the reference level Append Point Inserts an edit point Delete Point Deletes the point that you are editing Build From Sets a trace for building the limit line The range is from Trace1 to Trace6 Build Builds the limit line from the selected trace Copy From Copies th...

Page 85: ...gs in the current measurement mode will be set to Auto This operation does not affect other measurement modes In auto state the auto coupled parameters are changed with their coupled parameters The auto coupling operation will ensure the optimal performance of the instrument After the operation all the auto coupled parameters will immediately be automatically reset based on the coupled parameters ...

Page 86: ...rage auto power type start line and stop line 1 Avg Number Specifies the number of times for averaging the measurement results You can use the numeric keys the knob or arrow keys to modify this parameter you can also use the touch screen to modify the parameter Table 2 29 Average Count of T Power Measurement Parameter Remarks Default 10 Range 1 to 1 000 Unit None Knob Step 1 Left Right Arrow Key S...

Page 87: ...n the start line and stop line The detector type is set to Voltage Avg automatically RMS Displays the root mean square value expressed in W of the voltages of signals between the start line and stop line The detector type is set to RMS Avg automatically 5 Start Line Sets the left margin in time unit of T Power measurement The calculation range for the data of T Power measurement is from the start ...

Page 88: ... Right Arrow Key Step Up Down Arrow Key Step at 1 1 5 2 3 5 7 5 step 7 Auto Couple When you enable Auto Couple function all the manual auto settings in the current measurement mode will be set to Auto In auto state the auto coupled parameters are changed with their coupled parameters The auto coupling operation will ensure the optimal performance of the instrument After the operation all the auto ...

Page 89: ...between the upper channel and the main channel in dBc Lower displays the power of the lower channel and the power difference between the lower channel and the main channel in dBc Measurement Parameters average count average mode auto average main channel bandwidth adjacent channel bandwidth and channel spacing 1 Avg Number Specifies the number of times for averaging the measurement results You can...

Page 90: ...lt it is set to On 4 Main Chan BW Sets the bandwidth of the main channel and the power of the main channel is the power integral within this bandwidth You can use the numeric keys the knob or arrow keys to modify this parameter you can also use the touch screen to modify the parameter Table 2 33 Main Channel Bandwidth for ACP Measurement Parameter Remarks Default 2 MHz Range 33 Hz to 2 5 GHz Unit ...

Page 91: ...hat of the adjacent channels Adjusting this parameter will also adjust the distance between the upper lower channel and the main channel You can use the numeric keys the knob or arrow keys to modify this parameter you can also use the touch screen to modify the parameter Table 2 35 Channel Spacing for ACP Measurement Parameter Remarks Default 2 MHz Range 33 Hz to 2 5 GHz Unit GHz MHz kHz Hz Knob S...

Page 92: ...Measurement Parameters average count average mode auto average channel frequency and channel span 1 Avg Number Specifies the number of times for averaging the measurement results You can use the numeric keys the knob or arrow keys to modify this parameter you can also use the touch screen to modify the parameter Table 2 36 Average Count for Multi channel Power Measurement Parameter Remarks Default...

Page 93: ... editing table when a channel is selected this menu displays the center frequency of the selected channel If you modify the frequency at this time the center frequency of the corresponding selected channel will be updated at the same time When no channel is selected in the channel editing table this menu displays the center frequency of the last selected channel At this time you can set the center...

Page 94: ... channel is selected in the channel editing table pressing this key can add a channel whose center frequency is the same as the value under Channel Freq and whose span is the same as the value under Channel Span Note that when you select Off under Channel Sheet this Add Channel menu is also valid 6 Delete Channel Press this key to delete the currently selected channel Note that when you select Off...

Page 95: ...e bandwidth occupied by the power based on the specified power ratio Transmit Frequency Error indicates the difference between the center frequency of the channel and that of the spectrum analyzer Measurement Parameters average count average mode auto average max hold span and power ratio 1 Avg Number Specifies the number of times for averaging the measurement results You can use the numeric keys ...

Page 96: ...s whether to averaging the measurement results By default it is set to On 4 Max Hold Enables or disables max hold By default it is Off When Max Hold is enabled each measurement result is compared with the previous result and then display whichever is the maximum When Max Hold is disabled the current measurement result is displayed Max Hold and average measurement mode are mutually exclusive When M...

Page 97: ...6 Power Ratio Sets the percentage the signal power takes up in the whole span power You can use the numeric keys the knob or arrow keys to modify this parameter you can also use the touch screen to modify the parameter Table 2 40 Power Ratio for OBW Measurement Parameter Remarks Default 99 Range 1 to 99 99 Unit Knob Step 0 01 Left Right Arrow Key Step Up Down Arrow Key Step 1 For details about the...

Page 98: ...span and then finds the two frequency points f1 and f2 at the left and right side of f0 at which the signal amplitude is X dB below the maximum amplitude The EBW equals to f2 f1 Measurement Parameters average count average mode auto average max hold span and X dB 1 Avg Number Specifies the number of times for averaging the measurement results You can use the numeric keys the knob or arrow keys to ...

Page 99: ... disabled the current measurement result is displayed Max Hold and average measurement mode are mutually exclusive When Max Hold is enabled the average measurement mode will be automatically disabled 5 EBW Span This span is consistent with the span of the spectrum analyzer It refers to the frequency range of the sweep After it is set the span of the spectrum analyzer will be modified accordingly Y...

Page 100: ...le 2 43 X dB for EBW Measurement Parameter Remarks Default 10 dB Range 100 dB to 0 1 dB Unit dB Knob Step 0 1 dB Left Right Arrow Key Step Up Down Arrow Key Step 1 dB For details about the Auto Couple and Meas Preset menus refer to their descriptions on Page 2 44 www valuetronics com ...

Page 101: ...oise power Measurement Parameters average count average mode auto average offset frequency noise BW and carrier bandwidth 1 Avg Number Specifies the number of times for averaging the measurement results You can use the numeric keys the knob or arrow keys to modify this parameter you can also use the touch screen to modify the parameter Table 2 44 Average Count for C N Ratio Measurement Parameter R...

Page 102: ...ys to modify this parameter you can also use the touch screen to modify the parameter Table 2 45 Frequency Offset for C N Ratio Measurement Parameter Remarks Default 2 MHz Range 3 Hz to 2 166666 GHz Unit GHz MHz kHz Hz Knob Step offset frequency 100 Min 1 Hz Left Right Arrow Key Step Up Down Arrow Key Step at 1 1 5 2 3 5 7 5 step 5 Noise BW Sets the bandwidth of the noise to be measured You can us...

Page 103: ...u can also use the touch screen to modify the parameter Table 2 47 Carrier Bandwidth for C N Ratio Measurement Parameter Remarks Default 2 MHz Range 3 Hz to 2 166666 GHz Unit GHz MHz kHz Hz Knob Step carrier noise 100 Min 1 Hz Left Right Arrow Key Step Up Down Arrow Key Step at 1 1 5 2 3 5 7 5 step For details about the Auto Couple and Meas Preset menus refer to their descriptions on Page 2 44 www...

Page 104: ...count average mode auto average number of harmonics and sweep time 1 Avg Number Specifies the number of times for averaging the measurement results You can use the numeric keys the knob or arrow keys to modify this parameter you can also use the touch screen to modify the parameter Table 2 48 Average Count for Harmo Dist Measurement Parameter Remarks Default 10 Range 1 to 1 000 Unit None Knob Step...

Page 105: ...the knob or arrow keys to modify this parameter you can also use the touch screen to modify the parameter Table 2 49 Number of Harmonics for Harmo Dist Measurement Parameter Remarks Default 10 Range 2 to 10 Unit None Knob Step 1 Left Right Arrow Key Step Up Down Arrow Key Step 1 5 Harmonic ST Sets the sweep time of the harmonic measurement namely the sweep time of the spectrum analyzer You can use...

Page 106: ...r signal and base upper signal 3rd order lower intercept point power of base lower signal power of 3rd order lower signal power of base lower signal 3rd order upper intercept point power of base upper signal power of 3rd order upper signal 2 power of base upper signal Measurement Parameters average count average mode auto average and span 1 Avg Number Specifies the number of times for averaging th...

Page 107: ...times N is specified in Avg Number 3 Avg State Selects whether to averaging the measurement results By default it is set to On 4 TOI Span This span is consistent with the span of the spectrum analyzer It refers to the frequency range of the sweep After it is set the span of the spectrum analyzer will be modified accordingly You can use the numeric keys the knob or arrow keys to modify this paramet...

Page 108: ...tes the ratio of maximum voltage to minimum voltage in standing wave pattern VSWR bridge and the tracking generator RSA5065 TG RSA5032 TG are required during measurement Two measurements have to be performed according to the measurement wizard at the lower section of the interface measurement with the DUT disconnected represented by Trace6 and measurement with the DUT connected represented by Trac...

Page 109: ...kers By default Marker1 is selected When a marker is selected you can set its state The selected marker is marked on the math trace The measurement result at the current marker is displayed in the measurement wizard 5 Marker Mode Sets the type of the currently selected marker 6 Marker Freq Sets the frequency of the selected marker 7 Ref Value Sets the reference level to adjust the vertical positio...

Page 110: ...the amplitude and frequency of the point on the trace or the sweep time point Figure 2 14 Marker Remarks RSA5000 offers 8 markers Each time one marker or one pair of markers can be turned on In the Marker menu you can use the numeric keys the knob or the arrow keys to modify frequency or time to view the readout of different points on the trace You can also use the touch screen to do the above thi...

Page 111: ... a marker will be enabled at the center frequency of the current trace The readout resolution of the X axis frequency or time is related to the span To obtain a higher readout resolution reduce the span 2 Delta It is used to measure the difference between reference point and certain point on the trace X frequency or time and Y amplitude value When Delta is selected a pair of markers appears on the...

Page 112: ... displayed in the screen and the functions concerning the marker will also be disabled Reference Marker Sets the reference marker for the current marker By default the reference marker is the marker next to it Remarks Each marker can have another marker to be its reference marker If the current marker is a Delta marker the measurement result of the marker will be determined by the reference marker...

Page 113: ... 6 5 GHz Unit Readout Frequency or 1 Δtime the available unit is GHz MHz kHz or Hz Readout Time or Period the available unit is s ms μs ns or ps Knob Step Readout Frequency or 1 Δtime step span sweep points 1 Readout Time or Period step sweep time sweep points 1 Left Right Arrow Key Step Up Down Arrow Key Step Readout Frequency or 1 Δtime step span 10 Readout Time or Period step sweep time 10 Mark...

Page 114: ...s zero the reciprocal is infinite and is displayed 4 Period If you select Period to be the readout type the Position and the Fixed marker modes display the reciprocal of the marker frequency whereas the Delta marker displays the reciprocal of the frequency difference When the frequency difference is zero the reciprocal is infinite and is displayed Readout Auto Enables or disables the readout auto ...

Page 115: ...ble other markers except the Fixed or Off marker to move with it The fixed marker does not move along with other marker but if the fixed marker moves other non fixed markers will move with it Marker Table Enables or disables the marker table When it is set to On the lower section of the split screen displays all the enabled markers in the form of lists They include marker number trace number marke...

Page 116: ...RIGOL Chapter 2 Functions of the Front Panel of GPSA 2 72 RSA5000 User s Guide Figure 2 15 Marker Table Marker All Off Turns off all the enabled markers and their related functions www valuetronics com ...

Page 117: ...er is selected the center frequency step will be set to the frequency of the current marker If Delta marker is selected the center frequency step will be set to the frequency difference between the Delta marker and the reference marker This function is invalid in zero span Mkr Start Sets the start frequency of the analyzer to the frequency of the current marker If Position marker is selected the s...

Page 118: ...he amplitude of the reference marker if the current marker is the Delta marker then the reference level is set to the amplitude of the Delta marker MkrΔ CF Sets the center frequency of the analyzer to the frequency difference between the two Delta markers Only when Delta marker is selected can this function be valid This function is invalid in zero span MkrΔ Span Sets the span of the analyzer to t...

Page 119: ...at are located on both sides of the current marker and with N dB fall N 0 or rise N 0 in amplitude as shown in the figure below Figure 2 16 N dB Bandwidth Measurement Remarks When the measurement starts the analyzer will search for the two points which are located at both sides of the current point with N dB fall or rise in amplitude Once the two points are found the analyzer will display the freq...

Page 120: ...erage RMS 1 Noise When the noise measurement function is enabled the measurement result of the Y axis is the average noise level normalized to 1 Hz within the frequency band 2 Band Power In non zero span mode it calculates the total power within a span In zero span mode it calculates the average power within a certain time range 3 Band Density In non zero span mode the band density is the total po...

Page 121: ... band span is 5 of the span or 5 of the sweep time When you select Manual you can press Band Span to set it Marker Counter Enables or disables the frequency counter function of the current marker Remarks If no active marker currently exists turning on the frequency counter will open a Position marker automatically The frequency readout will be more accurate when the frequency counter is enabled In...

Page 122: ...nob Step gate time 100 Min 1 μs Left Right Arrow Key Step Up Down Arrow Key Step at 1 1 5 2 3 5 7 5 step Gate Time Auto Turns on or off the auto gate time for marker counter Remarks Enables the auto gate time and the gate time of the marker count is determined by the instrument automatically When the auto gate time is disabled press Gate Time to set it www valuetronics com ...

Page 123: ... with a marker The peak search for the Next Peak Next Peak Right Next Peak Left or peaks in the peak table must meet the specified peak search condition When no peak meets the specified peak search condition No peak found is displayed Next Peak Searches for and marks the peak whose amplitude on the trace is next to that of the current peak and which meets the peak search condition Next Peak Right ...

Page 124: ...ther one will be grayed out When the Cont Peak function is on if the current marker is off set the marker to Position mode and then execute the peak search operation Difference between Cont Peak and Signal Track In Cont Peak the system always searches for the maximum in the current frequency channel while in Signal Track the system will search for and mark the point with no more than 3 dB variatio...

Page 125: ...arks When the peak excursion function is enabled press Peak Excursion to set it When the peak excursion function is disabled the Peak Excursion menu is disabled and grayed out 5 Threshold Line Sets whether to display the peak threshold line or not By default it is off Remarks When the threshold state is on the threshold line is by default on when the threshold state is off the threshold line is of...

Page 126: ...rns on or off the peak table By default it is Off When the peak table is turned on the display is split into a measurement window and a peak table display window The peak table will be displayed at the lower section of the screen displaying the searched parameters frequency and amplitude that meet the criteria You can use the externally connected mouse to click and drag the slide bar use the scrol...

Page 127: ...s defined by the peak criteria reading out based on the current sort setting in the peak table Display Line Displays the peaks meeting the peak criteria and whose amplitudes are greater than the specified display line in the table Display Line Displays the peaks meeting the peak criteria and whose amplitudes are smaller than the specified display line in the table Note If the display line is off t...

Page 128: ...the display line level to change its display location This line can be used as either the reference for you to read the measurement result or the threshold condition for the peaks displayed in the peak table For details refer to descriptions in Display Line under System Display www valuetronics com ...

Page 129: ...d measurement Stable and consistent measurement speed Frequency mask trigger Diversified and advanced composite display In general the high speed data stream in real time mode can be used in the following two ways to be served as the data source of composite spectrum display or be compared with the frequency mask to produce the frequency mask trigger This chapter describes in detail the function k...

Page 130: ...tting menu In this menu Span is by default selected Span Acq BW Sets the frequency range of the current channel Remarks When you modify the span the start and stop frequency will be modified automatically with the center frequency remains to be unchanged In manual span mode the minimum span can be set to 5 kHz When set to the full span the span of analyzer is set to the currently supported maximum...

Page 131: ...ximum IF bandwidth of the installed option For the standard configuration the full span is 25 MHz For the Option RSA5000 B40 the maximum bandwidth for single data acquisition is 40 MHz so its full span is 40 MHz Ref Value PvT Sets the reference time for the horizontal axis in the PvT view Modifying this value will not cause you to restart measurements It is only used for trace display When you ena...

Page 132: ...p Ref Position PvT Sets the position of the reference time in the horizontal axis of the PvT view to Left Center or Right Note that this menu is only valid in PvT measurement mode Auto Scale PvT Selects the setting mode for the horizontal scale of the PvT view Note that this menu is only valid in PvT measurement mode Remarks When you select Auto the auto scale function enables you to automatically...

Page 133: ...art measurement Note that this menu is only valid in PvT measurement mode Table 3 4 Ref Level PvT Parameter Remarks Default 0 dBm Range 250 dBm to 250 dBm Unit dBm dBm V mV μV Knob Step For Log scale type step reference level 10 For Lin scale type step 0 1 dBm Left Right Arrow Key Step Up Down Arrow Key Step For Log scale type step reference level For Lin scale type step 1 dBm Scale Div PvT Sets t...

Page 134: ...your needs Note When the filter type is set to Rectangular RBW is automatically set to RBW1 and RBW2 through RBW6 are invalid Filter Type Ratio1 1 024 point Ratio2 521 point Ratio3 256 point Ratio4 128 point Ratio5 64 point Ratio6 32 point Gaussian 404 761 205 938 101 190 50 595 25 298 12 649 Flattop 212 187 107 958 53 047 26 523 13 262 6 631 Blackman Harris 399 131 203 074 99 783 49 891 24 946 12...

Page 135: ...o the actual measurement requirements You can refer to the following table Window Function Spectral Leakage Amplitude Accuracy Frequency Resolution Gaussian Moderate Good Moderate Flattop Good Excellent Poor Blackman Harris Excellent Good Moderate Rectangular Poor Poor Excellent Hanning Good Moderate Good Kaiser Good Good Moderate Note After you select the PvT measurement view in the PvT measureme...

Page 136: ...row Key Step at 1 1 5 2 3 5 7 5 step Note 1 If a persistence bitmap exists the minimum acquisition time can be set to 32 ms if no persistence bitmap exists the minimum acquisition time can be set to 100 μs Acq Time Auto Sets the state of the acquisition time for the spectrum analysis to Auto or Manual Remarks When Auto is selected the acquisition time adopts the default value When Manual is select...

Page 137: ...key to perform the continuous sweep or measurement operation This setting is global to all the activated traces and the detector types For details refer to Continue in Chapter 2 Single In RTSA mode the single sweep function is logically same as that in GPSA mode Press this key to perform the single sweep or measurement operation This setting is global to all the activated traces Note In RTSA mode ...

Page 138: ... number of times for acquisition after each trigger signal that meets the requirements generated a trigger Table 3 8 Acq Trigger Parameter Remarks Default 1 Range 1 to 8 192 Knob Step 1 Left Right Arrow Key Step Up Down Arrow Key Step at 1 1 5 2 3 5 7 5 step Power Trigger A trigger signal will be generated when the system detects that the IF signal power exceeds the set IF power Power Sets the tri...

Page 139: ...ey to enter the FMT editing interface You can use the front panel keys to set the FMT Besides you can also finger touch or use the keypad to set and edit the FMT parameters in the FMT editing interface In the visual prompt interface only available in the single window measurement mode you can set and edit the FMT parameters In the visual prompt interface you can quickly set the common parameters T...

Page 140: ...y activated mask type 2 Navigation Selects the first line of the mask editing table 3 Frequency Sets the frequency of the mask point Its range is within the frequency range supported by the analyzer 4 Amplitude Sets the amplitude of the mask point Its range is within the amplitude range supported by the analyzer 5 I nsert Point Adds a mask point 6 Delete Point Deletes the currently selected mask p...

Page 141: ...he FMT file and imports it to the selected mask 14 New Mask Clears the currently activated mask and creates a default new mask 15 X Offset Sets the offsets of all the frequency points of the currently activated mask 16 Y Offset Sets the offsets of all the amplitude points of the currently activated mask 17 Apply Offset Adds the X and Y offsets to each point of the current mask 18 X Axis Type When ...

Page 142: ...gger criteria Enter Two states are required to initiate a trigger event The signal must be outside the mask and then passes into the mask The trigger event occurs when the first non violating waveform is detected Leave Two states are required to initiate a trigger event The signal must be inside the mask and then passes out of the mask The trigger event occurs when the first non violating waveform...

Page 143: ...hrough Trace6 The trace type can be set to Clear Write Max Hold and Min Hold The trace type Average is disabled The trace math operation function is disabled Density Spectrogram view Only Trace1 is available The trace type can only be set to Clear Write and the rest trace types are disabled and grayed out The trace math operation function is disabled When making PvT related measurements select the...

Page 144: ...n PvT mode turns on Trace 1 and blanks all other traces This operation does not affect the trace type trace detector and other states Clear All PvT Clears all traces in PvT mode All the trace data will be set to the minimum trace value except the case that the trace is in Min Hold state When the trace is in Min Hold state the trace data will be set to the maximum trace value That is even if you tu...

Page 145: ...se to select a specified window as the current window and maximize the current window If you select a different window its corresponding menu will be different Normal Measurement I nterface Figure 3 1 Normal View After you select Normal to be the measurement type the measurement interface is shown in the figure above Press Meas Setup to set the relevant parameters Remarks In RTSA mode all signal s...

Page 146: ...ak or average detectors the white trace obtains detector data from all the data within the acquisition time when using the Sample detector the last FFT was used To display the signal status within a longer time range you can display multiple Density views on the screen The latest Density view is displayed with the highest brightness The longer the time from the latest Density view the lower bright...

Page 147: ...ted In the Spectrogram view a white horizontal line represents the currently displayed trace In the Spectrogram mode display trace 1 indicates the latest trace In the view each horizontal line represents a trace and the vertical Y axis represents time The latest trace data is displayed at the top of the Spectrogram by default and the historical traces are moved up one position The Spectrogram can ...

Page 148: ...iew zero time is the point where the first trace starts an acquisition meaning that each subsequent trace point is at a positive time that represents when that point was gathered relative to the start point Each trace is time stamped as it starts and this time is remembered for each trace With the increase of the traces the time difference for the successive traces get larger Density Spectrogram M...

Page 149: ...ogram view The combined Density and Spectrogram view display the traces the occurrences of all the signals within the acquisition interval time their corresponding frequency amplitude and time information PvT Measurement I nterface Figure 3 5 PvT View After you select PvT to be the measurement type the measurement interface is shown in the figure above Press Meas Setup to set the relevant paramete...

Page 150: ...rement interface is shown in the figure above Press Meas Setup to set the relevant parameters Remarks The PvT Spectrum view is displayed in multiple windows including PvT view and real time normal view In PvT Spectrum view multiple windows have a coupling relationship You can use the mouse or touch the screen to display one of the windows in full screen The parameter rule in the PvT Spectrum view ...

Page 151: ...l view and spectrogram view In PvT Spectrogram view multiple windows have a coupling relationship You can use the mouse or touch the screen to display one of the windows in full screen The parameter rule in the PvT Spectrum view is consistent with that in the single PvT view The parameter rule in the real time normal view is consistent with that in the single Normal view Select the Normal view Lim...

Page 152: ...asurement function is a measurement analysis function specially customized for 2FSK signal When you enter the SSC function interface the screen is automatically split into two sections for display with the upper section as the measurement window displaying the measurement trace the lower section as the measurement result window displaying the measurement results The measurement interface is shown ...

Page 153: ... times for averaging the measurement results The average value is displayed in a real time manner after each measurement is completed Table 3 10 Average Count Parameter Remarks Default 10 Range 1 to 1 000 Unit None Knob Step 1 Left Right Arrow Key Step Up Down Arrow Key Step 1 Limit Sets the parameters of limit lines For details refer to Limit in Chapter 2 Only when you select Normal view can the ...

Page 154: ...inite mode Infinite mode shows the total number of times a frequency amplitude point appear during all the capture intervals since starting the measurement In the infinite mode the intensity for all the frequency amplitude points is 100 and there will be no fading but its density will change with the measurement time 3 Color Palettes Selects different color palettes which allows optimization of vi...

Page 155: ...ss the colors towards the higher end of the color bar and decreasing the nonlinearity value will compress the colors towards the lower end of the color bar Table 3 13 Curve Nonlinearity Parameter Remarks Default 75 Range 100 to 100 Unit None Knob Step 1 Left Right Arrow Key Step Up Down Arrow Key Step at 1 1 5 2 3 5 7 5 step 7 Auto Adjust Color Sets the highest density due to the highest density v...

Page 156: ...rmula is as follows Trace Time Trace Number x Acquisition Time 3 Couple Marker Trace Sets whether to couple the marker to the selected trace Turn on a marker and set Marker Z to n The available range of n is from 1 to 8 192 Set the Display Trace number to n At this time enable the Trace Couple function Then the marker will stay with the selected Trace n and changes with it When you disable the Tra...

Page 157: ...Region D E When adjusting the reference hue you are adjusting the hue at the top of the color bar The bottom of the color bar shows the hue that is 240 degrees clockwise from the reference hue 5 Ref Hue Pos Sets the position of the reference hue displayed in the graticule Any amplitudes higher than the reference position are displayed as black Table 3 16 Reference Hue Position Parameter Remarks De...

Page 158: ...e Max Hold When the Max Hold is enabled the signal captured each time will be compared with the last captured signal whichever is the larger value will be displayed as the max hold trace 2 Reset Clears the existing measurement results 3 Mark Line1 State Enables or disables Mark Line1 When Mark Line1 is enabled a blue vertical line is displayed in the basic measurement window 4 Mark Line1 Displays ...

Page 159: ...ement result display window Otherwise it indicates Fail At this time Fail is displayed in the measurement result display window Off A message indicates that test stops is displayed in the measurement result display window 8 Limit Edit Sets the amplitude limit range of all peaks in the Pass Fail test Signal Selects a signal to edit its amplitude limit range The peaks that correspond to the selected...

Page 160: ...n you select the Spectrogram view can this menu be effective For details about the marker refer to relevant contents of Marker in Chapter 2 Marker To In RTSA mode the Marker To function in the real time spectrum view is basically the same as that for GPSA In the PvT measurement view only the Mkr Ref menu is supported For details about the marker refer to relevant contents of Marker To in Chapter 2...

Page 161: ...n the measurement system outside the instrument Remarks The value does not affect the trace position but will modify the parameters such as reference level readout and the marker amplitude readout You can use the numeric keys the knob and the arrow keys on the front panel to modify this parameter also you can modify it on the touchscreen For details refer to descriptions in Parameter Setting Table...

Page 162: ...www valuetronics com ...

Page 163: ...y Auto Tune Automatically searches for the signal within the full frequency range and adjusts the frequency and amplitude for optimal display effect of the signal to realize one key signal search and auto setting of parameters Figure 5 1 Before Auto Search www valuetronics com ...

Page 164: ... on the front panel turns on After the search is finished the backlight of the key turns off Some parameters such as the reference level scale input attenuation and maximum mixer level may be changed during the auto search Enable the AMK function or the calibration signal in GPSA mode or the Auto Tune function is disabled in RTSA mode www valuetronics com ...

Page 165: ...ameter Value RTSA Parameter Value RSA5000 B40 Non PvT PvT FREQ Center Freq 3 25 GHz 3 25 GHz Start Freq 0 Hz 3 23 GHz Stop Freq 6 5 GHz 3 27 GHz CF Step Auto 650 MHz Auto 4 MHz Freq Offset 0 Hz 0 Hz Signal Track Off SPAN Span 6 5 GHz 40 MHz Ref Value 0 us Scale Div 2 99885 ms Ref Position Left Auto Scale Auto AMPT Ref Level 0 dBm 0 dBm Attenuation Auto 10 dB Auto 10 dB RF Preamp Off Off Y Axis Uni...

Page 166: ...1 Power 0 dB Mask Type Upper Trigger Mask Upper Trigger Criteria Enter Active Mask Upper Frequency 0 Hz Amplitude 0 dB Build From Trace Trace1 X Offset 0 Hz Y Offset 0 dB X Axis Type Relative Y Axis Type Relative Trace Selected Trace Trace1 Trace1 Trace Type Clear Write Clear Write Trace Det Normal Pos Peak Pos Peak Detector Auto On On On Trace Update On On On Trace Display On On On Math Function ...

Page 167: ...State On Test Limits Off Select Limit Limit1 Limit State Off Test Trace Trace1 Limit Type Upper X to CF Relative Y to Ref Relative Margin Off 0 dB Frequency 0 Hz Amplitude 0 dBm Build From Trace Trace1 X Offset 0 Hz Y Offset 0 dB Select Limit Limit1 Limit Type Upper X To CF Fixed Y To Ref Fixed Margin Off 0 dB Test Trace Trace1 Test Limits On Limit State Off T Power Avg Number Off 10 Avg Mode Expo...

Page 168: ...er Off 10 Avg Mode Exponential Avg State On Max Hold Off OBW Span 2 MHz Power Ratio 99 Emission BW Avg Number Off 10 Avg Mode Exponential Avg State On Max Hold Off EBW Span 2 MHz EBW X dB 10 dB C N Ratio Avg Number Off 10 Avg Mode Exponential Avg State On Offset Freq 2 MHz Noise BW 2 MHz Carrier BW 2 MHz Harmo Dist Avg Number Off 10 Avg Mode Exponential Avg State On No of Harmo 10 Harmonic ST 1 ms...

Page 169: ...ity Avg Number 100 Persistence 300 ms Pers Inf Off Color Palettes Warm Highest Density Hue 100 Lowest Density Hue 0 Curve Nonlinearity 75 Hue Truncate Off Spectrogram Avg Number 100 Display Trace 0 Trace Selection Trace Number Couple Marker Trace Off Ref Hue 0 Ref Hue Pos 100 Bottom Hue Pos 0 SSC Max Hold Off Mark Line1 Off 3 23 GHz Marker Line2 Off 3 27 GHz Pass Fail Off Signal 1 Ampt Up 100 dBm ...

Page 170: ...able Readout All All Marker Func N dB Bandwidth Off 3 01 dB Off 3 01 dB Band Function Off Off Off Marker Counter Switch Off Gate Time On 100 ms System 3 Power On Preset Preset Preset Type Default Default Align Auto On On LAN Setting Mode DHCP DHCP Display Line Off 25 dBm Off 25 dBm Graticule On On HDMI Off Off HDMI Resolution 1024 768 60Hz 1024 768 60Hz LCD On On LCD Backlight 80 80 Power Switch D...

Page 171: ...u or function Note You can use the User key to define all the keys on the front panel and the sub menus of these keys except Save Quick Save Repeats the most recent save that was performed from the Save menu Its saving path is the currently defined quick save path The register storage does not support Quick Save Cont Press this key to perform the continuous sweep operation For details refer to Con...

Page 172: ...www valuetronics com ...

Page 173: ...cally at power on 2 Preset Type Sets the preset type to Default by default or any one of the items from User1 to User6 When Power On is set to Preset the specified preset type will be recalled at power on After the instrument starts press Preset on the front panel in any operation interface will recall the specified preset type 3 Save User Preset Saves the current system setting as user defined se...

Page 174: ... the LAN parameters Tap the setting information icon at the top of the user interface or use the externally connected mouse to click the icon and then click the network setting icon Then the LAN parameter setting interface as shown below is displayed Figure 6 1 LAN Parameter Setting The following items can be set by the front panel keys the keyboard shortcut keys the externally connected mouse the...

Page 175: ... the numeric keys to input the desired subnet mask The format of the subnet mask is nnn nnn nnn nnn wherein the range of nnn is from 0 to 255 You are recommended to ask your network administrator for a subnet mask available 4 Gateway Press Gateway and use the numeric keys to input the desired gate address The format of the default gateway is nnn nnn nnn nnn The range for the first segment nnn of t...

Page 176: ...sult or the threshold condition for the peaks displayed in the peak table Remarks This line is a horizontal reference of which the amplitude is equal to the set value and the corresponding amplitude unit is the same as the Y axis unit You can use the numeric keys the knob and the arrow keys on the front panel to modify the display line level also you can modify it on the touchscreen For details re...

Page 177: ...light Sets the brightness of the LCD backlight The brightness is expressed in percentage When it is 100 it indicates that the backlight is the brightest when it is 1 the backlight is the darkest About System Displays the system information or the option information 1 System I nfo Model Serial Number Hardware Version Number Firmware Version Number Software Version 2 Option I nfo Displays the option...

Page 178: ...hether the corresponding key is illuminated If not an error may have occurred to that key To exit the test press Esc for three consecutive times Note For the transparent keys on the front panel they will be also illuminated during the test 4 License I nfo Displays the license registration information about the components such as Linux and QT 5 Online Update Connect the analyzer to the external net...

Page 179: ...el to start up the analyzer Always When the analyzer is powered on it starts automatically 2 Beep Switch Turns on or off the beeper 3 Volume After you turn on the beeper you can press this key to adjust the volume of the beeper 4 User Key Defines an associated function for the User key on the front panel The definition method is as described below After that pressing User in any operation interfac...

Page 180: ...he externally connected mouse to tap or click the specified icon in the prompt message dialog box 1 Select All Selects all the displayed messages 2 Select Read Only selects the messages that have been read 3 Select Unread Only selects the messages that have not been read 4 Delete Deletes the selected messages 5 Query All Views all the displayed messages 6 Query Read Only views the messages that ha...

Page 181: ...touch gestures to tap the screen or use the mouse to click on the screen to select the corresponding file or folder Displays all the files with the specified file types When you select a file you can press the Copy Paste or Delete softkeys to copy paste or delete the specified file Figure 6 2 File Manager The available file types include State Trace State Measurement Data Limit Screen Image Licens...

Page 182: ...the filename or folder name contains other characters the file or the folder might not be displayed normally in the file manager interface Copy Copies the currently selected file or folder Paste Pastes the file or folder When the current path has contained a file or folder whose name is the same as the one that you want to paste after you perform the paste operation the original file or folder wil...

Page 183: ...print parameter settings when the printer has been successfully installed and is in idle state Printer Setup 1 Printer Parameters 1 Page Size Sets the page size for printing When Default is selected the page size depends on the printer currently connected 2 Quality Sets the print quality 3 Color Sets the print color to Color Mono Inverse or Inverse Mono 4 Orientation Sets the print orientation to ...

Page 184: ... address of the printer the manufacturer of the printer the printer model and printer drive Then the printer is added 3 Select Device Selects the desired printer I mport License In the file manager interface select a file to be imported and then press I mport License to import the file System Update Press this key to update the analyzer software after selecting the update file in the USB storage d...

Page 185: ...ll the file from a register or a file 2 Register1 through Register16 When any one of the items from Register1 to Register16 is selected the state of the specified register will be recalled Trace State Press Trace State to enter the trace state recalling menu The state of the instrument and the selected trace can be recalled from a register or a file 1 Recall Press File Explorer to enter the file m...

Page 186: ...ed trace Limit Press Limit to enter the limit recalling menu 1 Recall Press File Explorer to enter the file manager interface Select a file and then press Recall to recall the file 2 To Limit Selects the limit line file and recalls it to the selected limit line FMT only available for RTSA Press FMT to enter the FMT recalling menu 1 Recall Press File Explorer to enter the file manager interface Sel...

Page 187: ... is the existing maximum file number plus 1 For example if 3 files state1 sta state2 sta state5 sta exist in the current directory then the new filename for the file that you want to save should be state6 sta by default If you have pressed the Save As key to input the filename abc then the file is saved to be abc sta After that press the Save key again another file is saved automatically with the ...

Page 188: ...trs 2 Save As Press this key and then use the numeric keypad on the front panel to input the filename Then press Save to save the corresponding trace state file You can also touch the screen or use the mouse to touch or click the Save As menu and then input the filename with the keypad 3 Save From Trace Selects the trace to be saved You can select any single trace from Trace1 to Trace6 4 Register1...

Page 189: ...ta file You can also touch the screen or use the mouse to touch or click the Save As menu and then input the filename with the keypad 3 Save From Trace If the data to be saved are traces select the trace to be saved You can select any single trace from Trace1 to Trace6 4 Data Type Selects the measurement data type to be saved The data types supported by the instrument include trace peak table mark...

Page 190: ...ult filename is determined by the following methods If you haven t input a filename by pressing the Save As key its default filename is screen n jpg Wherein n refers to the file number of the filenames that are named based on the naming mode in the current file directory The value of n is the existing maximum file number plus 1 If you have pressed the Save As key to input the filename abc then the...

Page 191: ... on the naming mode in the current file directory The value of n is the existing maximum file number plus 1 If you have pressed the Save As key to input the filename abc then the file is saved to be abc csv After that press the key again another file is saved automatically with the filename abc1 csv 2 Save As Press this key and then use the numeric keypad on the front panel to input the filename T...

Page 192: ...www valuetronics com ...

Page 193: ...e Control You can control RSA5000 series spectrum analyzer through USB or LAN remote interface This chapter introduces remote control and the control method Contents in this chapter Remote Control Overview Remote Control via USB Remote Control via LAN www valuetronics com ...

Page 194: ...ent Software Architecture library For details about the SCPI commands and programming refer to RSA5000 Programming Guide 2 PC software You can use the PC software Ultra Sigma to send the SCPI commands to remotely control the instrument This Chapter introduces in details how to use Ultra Sigma to send commands through each kind of interface to control the analyzer Please refer to Ultra Sigma help d...

Page 195: ...tra Sigma here we assume that you have installed Ultra Sigma properly and the software will automatically search for the resource currently connected to the PC You can also click to search for the resource 4 View the device resource The resources found will appear under the RIGOL Online Resource directory and the model number and USB interface information of the instrument will also be displayed F...

Page 196: ...he panel Select the desired resource and click to add the resource Note The IP address of the selected resource should be consistent with that of the LAN interface If you want to remove the resource please select the resource name and then click to remove it 4 View the device resource The resources found are shown under the RIGOL Online Resource directory For example RSA5065 TCPIP 172 16 3 194 INS...

Page 197: ...e If you want to view or modify the network settings of this instrument please click Network Settings and then a pop up window is displayed Input rigol rigol must be in lowercase form without quotation marks in the user name and the password fields Besides you can click Security to reset the password Tip You can also directly input the IP address of the analyzer in the address bar of the PC browse...

Page 198: ...www valuetronics com ...

Page 199: ... specified fuse AC 250V T3 15A 2 One or more keys on the keyboard does do not respond and stuck keys are found 1 After you power on the instrument check whether all the keys are unresponsive 2 Press System About System Self Test Keyboard and check whether there are unresponsive keys or stuck keys 3 If the above problems are found check whether the keyboard cables are loose or the keypad is damaged...

Page 200: ...n after the stated calibration period expires contact RIGOL or get paid service from authorized measurement agencies The analyzer provides self calibration function If required press System Alignment Align Auto and select On The analyzer will perform one self calibration after being started Press System Alignment Align Now to make a self calibration immediately 5 Prompt Message A prompt message wi...

Page 201: ...ware Optional Accessories Include N SMA cable BNC BNC cable N BNC adaptor N SMA adaptor 75 Ω 50 Ω adaptor 900 MHz 1 8 GHz antenna 2pcs 2 4 GHz antenna 2pcs DSA Utility Kit Include N F N F adaptor 1pcs N M N M adaptor 1pcs N M SMA F adaptor 2pcs N M BNC F adaptor 2pcs SMA F SMA F adaptor 1pcs SMA M SMA M adaptor 1pcs BNC T type adaptor 1pcs 50 Ω SMA load 1pcs 50 Ω BNC impedance adaptor 1pcs RF Adap...

Page 202: ...ree replacement or repair for the defective product To get repair service please contact with your nearest RIGOL sales or service office There is no other warranty expressed or implied except such as is expressly set forth herein or other applicable warranty card There is no implied warranty of merchantability or fitness for a particular purpose Under no circumstances shall RIGOL be liable for any...

Page 203: ...c ST 2 61 IF Power Trigger 3 10 Input Attenuation 2 10 Input Impedance 4 1 Intercept 2 62 IP 6 3 ITime 2 70 Keyboard Test 6 6 LAN 6 2 Last Span 2 8 3 3 Main Channel Bandwidth 2 46 Main Channel Power 2 45 Manual IP 6 3 Marker Table 2 71 Marker Trace 2 68 Mask Type 3 11 Max Hold 2 26 2 52 2 55 Min Hold 2 26 Mkr CF 2 73 Mkr Ref 2 74 Mkr Start 2 73 Mkr Step 2 73 Mkr Stop 2 73 MkrΔ CF 2 74 MkrΔ Span 2 ...

Page 204: ...Trace 2 34 Scale Type 2 12 Screen Test 6 5 Signal Track 2 6 Single point Touch 6 6 Span 2 8 2 52 2 63 3 2 Spectrogram 3 19 Start Freq 2 4 Start Line 2 43 Stop Freq 2 4 Stop Line 2 43 Subnet Mask 6 3 Sweep Time 2 18 System Info 6 5 TOI 2 36 TP Type 2 43 T Power 2 35 2 42 Tracking Generator 2 32 USB 6 4 VBW 2 14 VBW RBW Ratio 2 16 Video 2 22 Video Bandwidth 2 14 VSWR 2 37 2 65 VSWR Ref Level 2 65 Y ...

Reviews: