Hear-it! Solution Kit
5 Embedded Firmware Application
R12UZ0012EG0110 Rev. 1.10
Page 23 of 34
Apr 03, 2017
5.5
Running in Debug Mode
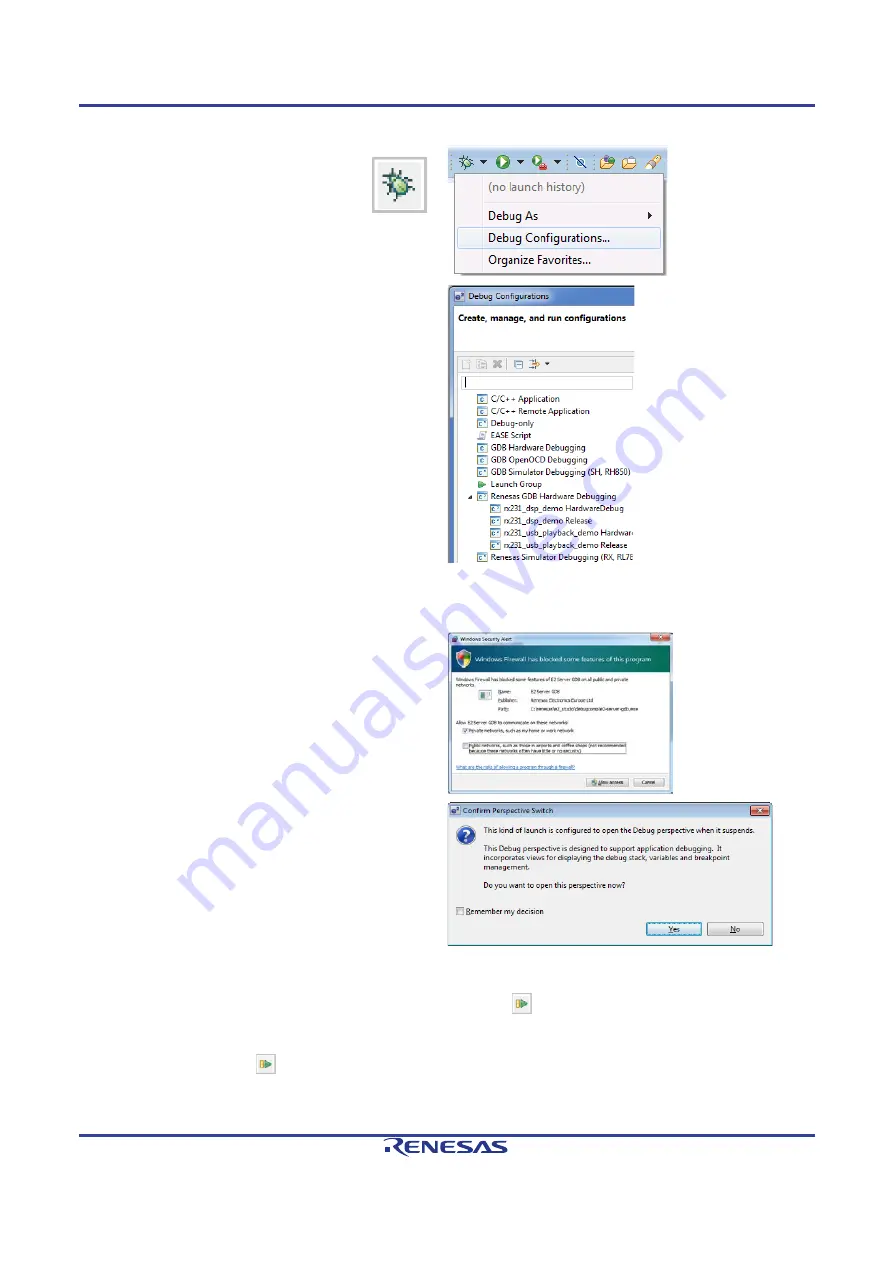
Click the arrow next to the debug
button (bug icon). Select ‘Debug
Configurations
The ‘Debug Configurations’ dialog box will appear.
Click the small arrow next to the ‘Renesas GDB
Hardware Debugging’ option.
The debug configurations for each project will
appear. The examples for the streaming
application rx231_dsp_demo are shown to the
right. Select the entry for the required debug
configuration.
If the configuration has been built and the required
executable is present, the ‘Debug’ button in the
bottom right of the window will be active.
Click the ‘Debug’ button to continue. e
2
studio will
now connect to the debugger and download the
code to the target.
A firewall warning may be displayed for ‘e2-server-
gdb.exe’. Check the ‘Private networks, such as
my home or work network’ box and click ‘Allow
access’.
A user account control dialog may be displayed.
Enter the administrator password and click ‘Yes’.
After downloading the code a dialog box will
appear asking if you would like to switch to the
‘Debug perspective’. Click ‘Remember my
decision’ to prevent this dialog box from appearing
in future, then click ‘Yes’.
e
2
studio will load the new perspective, which is
optimised for debugging.
5.6
Running the Hear-it! Application Code
Once the code has been downloaded, click the ‘Resume’ button
to run the code to the main function. The
main function is the default program entry point. The program counter will stop on the first instruction in the
main function.
Click the ‘Resume’ button
in the ‘Debug’ perspective to run the rest of the code.
Follow the instructions on the PMOD
TM
display.
Summary of Contents for RX231
Page 34: ...RX231 Group R12UZ0012EG0110 ...


