25
3 USER
GUIDE
3.4 User
Menu
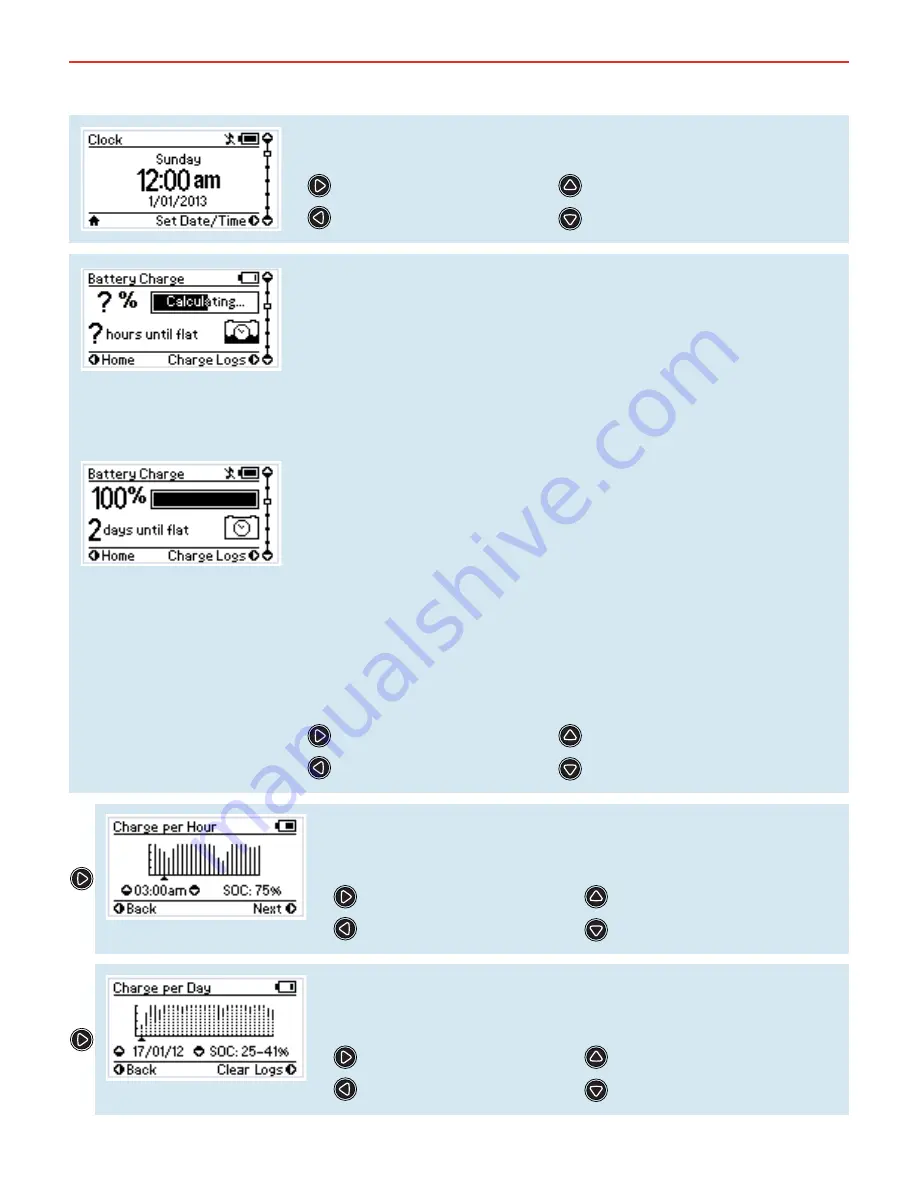
The Manager30 features a real time clock (time and date) function which needs
to be setup when the power is fi rst connected.
Set the Time & Date
N/A
Charging Status Screen
Battery Charge Screen
The Manager30 monitors current in and out of the house battery, keeping track
of the charge remaining. This screen displays the estimated state of charge of
the house battery in percentage along with a bar graph. For the duration of the
initial charge cycle for a new battery this screen will show ‘Calculating’. This is
when The Manager30 is gathering information about the battery under charge.
State of Charge is determined by current in or out of the house battery, and uses
the fi rst charge cycle (Calculating) and the battery size input by the user at setup
to determine what the full State of Charge should be.
Once The Manager30 has calculated the full state of charge for the system this
screen will display either the Time to Full Charge or the Battery Time Remaining,
depending on whether the house battery is currently being charged or discharged.
The Manager30 uses the estimated State of Charge value to calculate, based on
the current into and out of the house battery, the time to reach 100% State of
Charge. You may use this to decide when to disconnect AC power, for example.
Similarly, The Manager30 uses the estimated State of Charge value to calculate
- based on the current power usage of the system (e.g. of loads such as fridges,
lighting) - the useful time remaining of the battery.
NOTE: Zero State of Charge occurs when The Manager30 determines that the
amount of charge removed from the house battery, in Ah, is equal to the amount
input by the user at initial setup.
View Charge Logs (per Hour)
Home Screen (Clock)
Home Screen (Clock)
Input Status Screen
The Charge per Hour screen displays the average State of Charge of the
battery under charge at the end of each hour across the course of the last
day. The most recent hour is always the right most line on the graph.
View Charge Logs (per Day)
Battery Charge Screen
Previous Hour SoC
Next Hour SoC
The Charge per Day screen displays the maximum and minimum State of
Charge of the battery under charge for each day across the course of the last
month. The most recent day is always right most line on the graph.
Clear Logs (Hold to Confi rm)
View Charge Logs (per Day)
Previous Day SoC
Next Day SoC


