


Manual-19
THE OVERALL RESPONSE
CURVE
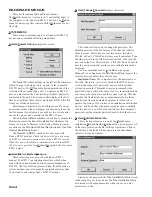
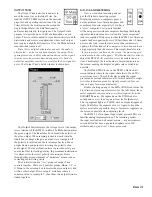
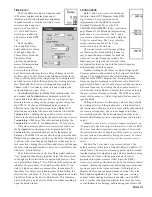
Double-clicking on any
output’s screw terminal (shown
at the right) opens the Overall
Response curve window (shown
below). The displayed curve(s)
display the frequency response
contribution of the equalization
settings currently active in the
RPM 26. Though not necessarily
useful unless you are implementing a
6-way crossover, it is possible to
display the Overall Response curves
for all six of the RPM’s outputs. The
output(s) being viewed are indicated
by the check boxes on the bottom left
of the window. These boxes provide a
convenient way to quickly display the response curves of
other outputs or combinations of outputs. Two radio
buttons labeled A and B, allow selection of the prefered
Input (A or B) for the response curve comparison, when
an output contains the simple sum of the two Input
signals. It is not possible in RaneWare to display the
“calculated” sum of the response curves. This informa-
tion has limited relevance to the acoustic sum of the
responses. It is more insightful to use an analyzer to
perform this task. The curves shown are the calculated
responses of the RPM 26. Do not mistake these curves
for the response of your system. It is highly recom-
mended, and some would say, required, to use a high
quality analyzer to get a true indication of your system’s
overall response. These analysis devices include the
contributions of all components of the system, including
the RPM 26, amplifiers, cabling, loudspeaker and
generally the room responses.
The check boxes on the bottom right allow viewing
of the
Input EQ
(either High/Low Cut or PEQ filters),
Crossover
(if applicable) and
Output EQ
(parametric
EQ). This makes it convenient to independently view the
frequency response contribution of the various filter
sections in the RPM 26. The graph in the example above
does not show the contribution of the crossover, since the
Crossover
box is unchecked.
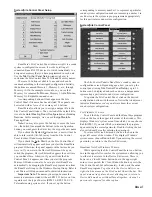
LIMITER
For most DSP Programs, each output is supplied
with a Limiter. The limiter is meant to be a safety
device to stop the RPM’s output from exceeding a
predetermined threshold voltage.
The Limiter block has a single yellow indicator
that turns on when the output reaches the limiter’s
Threshold.
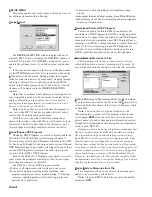
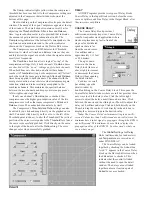
Double-clicking on the Limiter block opens the Limiter detail
window. Scroll bars for adjusting the
Threshold
,
Attack
and
Release
times appear on the left. There are three ways to alter the
settings with the scroll bar. Click and drag the Thumb to the
desired value, click between the Thumb and the arrows to adjust in
large steps or click the left or right arrows to adjust in single steps.
The
Limiting
indicator on the bottom left indicates when the signal
has reached the
Threshold
. This
Limiting
indicator corresponds to
the indicator on the Limiter block in the Device Edit screen.
Each Limiter contains a
Combine
selection box. Limiters are
combined when the numbers in the selection boxes match. The
choices are
None
,
1
,
2
or
3
.
None
in a selection box indicates the
given Limiter is tied with no other Limiter.
When Limiter
Combine
boxes share a common value, for
example,
3
, then those Limiters are
Combine
d together. The
Combine
d Limiter with the most gain reduction always dictates
what instantaneous gain reduction, attack and release settings are
applied to each
Combine
d
channel in its group. This
maintains the spectral balance
between the
Combine
d channels
and helps maintain your
program’s left-to-right image.
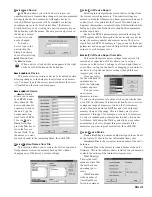
The Limiter’s
Threshold
setting can also be edited if you
click and drag directly on the
graphed curve. The vertical
position of the cursor corre-
sponds to the
Threshold
level
once the curve is successfully
grabbed. The curve changes
color when successfully grabbed.


