DoseRAE 2 User’s Guide
98
Note:
You can move the graph around in the
window by clicking and dragging with your mouse.
In addition, if “Show X and Y Information” is on,
wherever you point with the mouse, a tool tip shows
you the coordinates (time vs. dose, for example).
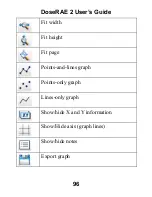
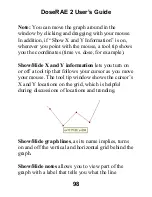
Show/Hide X and Y information
lets you turn on
or off a tool tip that follows your cursor as you move
your mouse. The tool tip window shows the cursor’s
X and Y locations on the grid, which is helpful
during discussions of locations and trending.
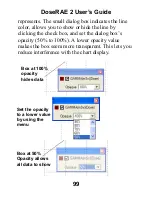
Show/Hide graph lines
, as its name implies, turns
on and off the vertical and horizontal grid behind the
graph.
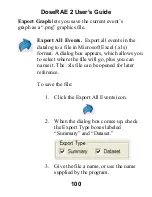
Show/Hide notes
allows you to view part of the
graph with a label that tells you what the line
Summary of Contents for DoseRAE 2
Page 2: ...2011 RAE Systems Inc...
Page 115: ...DoseRAE 2 User s Guide 113...
Page 116: ...P N 035 4025 000 Rev A March 2011...


