background image

12

Rev. E  / October 4, 2018

PGA-710B Autoanalysis System

6. Select 

Start a New Session Wizard

” and Click 

OK

 as in Figure 9, will open Session Wizard Test 

Type screen (Figure 10). Select Test Type and provide the requested informa  on to be included 
in test reports. See The Session Wizard sec  on below for further details.

7.  To open a fresh chart, simply select “

Start a New Session

”.

8.  Press New Document symbol on the tool bar to open addi  onal new 

fi

 les

B.  The Session Wizard

The Session Wizard is used to enter test infor-
ma  on, material iden  

fi

 ca  on, loca  on and 

notes. All informa  on entered in the Wizard will 
be included in the generated charts and test re-
ports. Informa  on is entered in any of the basic 
test scenarios: General Test, Voltage Genera-

 on Test, and Decay Test. The Wizard consists 

of an Opening Screen, Two General Informa  on 
Screens and Test Specialty screens for Voltage 
Genera  on and Decay Tests.
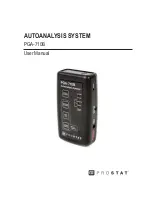
C. Opening Screen

The Opening Screen (Figure 10) is used to des-
ignate the type of test to be conducted. In the 
illustra  on at right, decay tes  ng is the intent of 
the test.

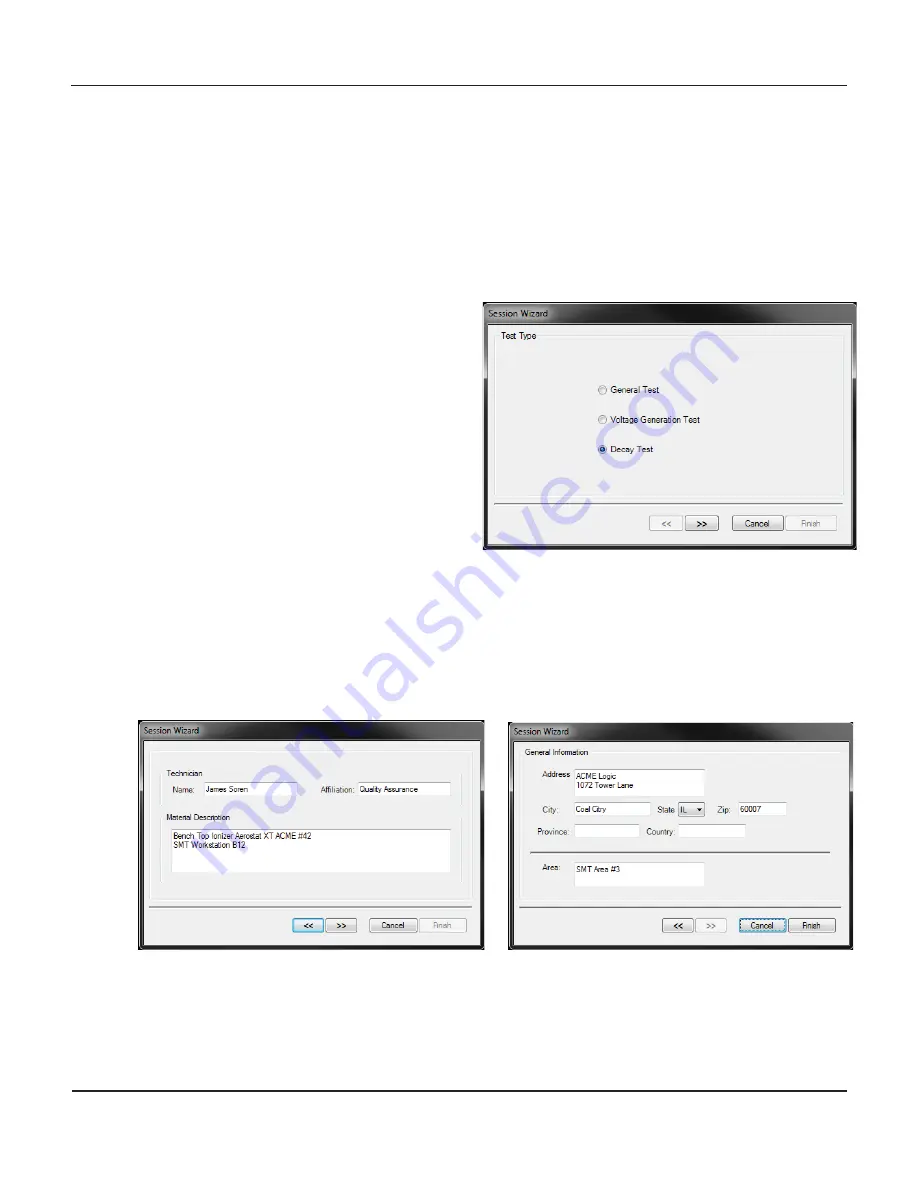
D. General Informa  on Screens

Two screens provide 

fi

 elds for a variety of descrip  ve and loca  on informa  on that is included on 

all charts and in detailed reports. The following two screens are included in all test type formats.

E.  Specialty Screens: Decay Tests

Decay measurements are used primarily for ioniza  on tes  ng. Decay tests have a beginning volt-
age where   ming begins or is “

Reset

”, and an ending voltage where   ming stops, or is “

Cuto


”. 

The following screens and windows are used to enter Reset and Cuto

  test voltages.

1.  Designate the voltages used to Start and Stop the decay   me period.

Figure 10: Use the 

fi

 rst Session Wizard Window to Des-

ignate the Type Test

Figure 11: Technician, Material and General Informa  on Screens

Summary of Contents for PGA-710B

Page 1: ...User Manual PGA 710B AUTOANALYSIS SYSTEM ...

Page 2: ......

Page 3: ...n Remote Tes ng 30 X Expor ng Impor ng Data to and from Excel Spreadsheets 32 XI Modifying XML Config File Defaults 34 XII Warranty Informa on 38 General Specifica ons 39 Applica on So ware System Requirements 40 Table of Contents Copyright 2012 by Prostat Corpora on All rights reserved Printed in the United States of America No part of this manual may be used or reproduced in any manner whatsoeve...

Page 4: ...SD Control products that can be evaluated using the PGA 710B Graphic Autoanalyzer in clude but are not limited to Ioniza on Device and System Offset Voltage Decay Performance Footwear and Flooring combina ons Worksurface Voltage Suppression Rolling Carts Record process equipment field voltages Chairs Si ng and Standing Func ons Packaging Materials Systems Produc on Aids Materials Other tests evalua...

Page 5: ...PFM 711A Field Meter field meter not provided and the signal input of the PGA 710B Autoanalyzer Part Number PGA 710AnaCab 3 The shielded voltage measurement cable with ground is used for body voltage body reten on and other measurement Connect the green shield lead to ground to reduce the effects of ambient electrical noise Part Number PGA 710ChgGen lead 4 Input Shor ng Shunt used to zero the PGA 7...

Page 6: ...ts do not drop or cause mechanical shock E The Autoanalyzer s analy cal program func on is based on operator input and the data supplied Thus the representa ve accuracy and value of system calcula ons are based on operator input and ac ons Prostat is not responsible for data analysis results or the decisions made based on PGA 710B Autoanalysis System data analysis IV Instrument Setup Computer Conn...

Page 7: ...ba ery charger The unit charges when connected to the computer via USB So ware Installa on Autoanalysis so ware requires NET Framework 4 0 installed on your computer It can be installed either thru Windows Update or from the installa on Flash Drive For your convenience NET Framework 4 0 will install automa cally from the Flash Drive if it s not already installed Figure 2 NET Framework 4 installa o...

Page 8: ...FM 711A Field meter via analog signal cable 7 Slide PGA 710B s ba ery cut off switch to the ON posi on 8 Press the System ON Sleep panel membrane pad and release when LED s energize 9 Your computer should recognize NEW HARDWARE 10 A er installa on Prostat Autoanalysis System shortcut will be installed on the desk top NOTE The first me the PGA 710B so ware is opened the operator has an opportunity t...

Page 9: ...next to Charger Connec on will energize during charging See circle in Figure 7 c In ON posi on unit is energized in sleep mode but is not opera onal un l System ON Sleep Pad 1 bu on is pressed 2 PAD 1 System ON Sleep Places unit in Normal Opera on or Sleep modes Figure 6 Front Panel Pad 4 Erase In Remote Ops Pad 3 Save In Remote Ops Pad 2 Start Stop In Remote Ops Pad 1 On Sleep LED 1 Low Ba LED 2 ...

Page 10: ...ses ALL FILES in memory 6 Reset Re boots PGA 710B in the case of latch up See Figure 5 B LED Indicators LED indicators provide informa on in computer connect and remote opera onal modes 1 LED 1 RED Low Ba ery level Charge ba ery via USB connec on to computer or using AC DC converter See Ba ery Consump on in Techni cal Specifica ons on page 39 a Unit operates normally during either charging mode Du...

Page 11: ...n memory 4 LED 4 YELLOW a ON when PGA 710B is connected to computer energized steady ON to indicate the ba ery is charging b LED 4 is ON when unit is ON and connected to the AC DC charger c During file management in remote opera ons 1 Blinks once when file is saved 2 Blinks fast alternately with LED s 2 4 during erase of ALL FILES in memory VI Prepara on for Recording Opera ons A Follow these ini ...

Page 12: ... Screen Two General Informa on Screens and Test Specialty screens for Voltage Genera on and Decay Tests C Opening Screen The Opening Screen Figure 10 is used to des ignate the type of test to be conducted In the illustra on at right decay tes ng is the intent of the test D General Informa on Screens Two screens provide fields for a variety of descrip ve and loca on informa on that is included on a...

Page 13: ...y take several forms In many tests the movement is repe ous much like a walk ing measurement The Wizard screen at the right Figure 13 allows the operator to es mate the number of cycles before the measurements begin The number can be changed later as necessary However it is the number of operator en tered cycles that drive the so ware s ini al algorithm analysis Thus it is important to be able to ...

Page 14: ...ors are individually selected using the drop down ar row In Figure 15 the zero Label and Line will be Red To change colors press the down arrow s to open the color selec on drop down menu s Choose from several colors Figure 16 for customizing lines and labels 7 Value allows different lines to be inserted in a chart at various voltage levels For example we might add colored lines at 100 and 100 volt...

Page 15: ...ing and before recording data save the chart as a template to reduce future setup me For example save the file as ChgGen Template1 tst When ever the file is recalled the chart se ngs are as you le them and the file is ready to record data and be saved with a new name NOTE Crea ng Test Templates are convenient and save a great deal of me However once data is recorded and saved in a file it cannot b...

Page 16: ... se ngs 4 Press the Set Device Time bu on to set the PGA 710B s me clock to the computer 5 Press Done to close the window I Sampling Rate The PGA 710B s default Sampling Rate is 50 samples second which is suitable for most audi ng and analysis applica ons To confirm or modify the rate proceed as follows 1 Open the Edit drop down menu 2 Select Device Control and a Device Control window Figure 20 ap...

Page 17: ...Temperature F Value window is set at 0 0 and click Clear 4 Click Done to close the window Once sensors are reset use a calibrated temperature and humidity instrument as a reference to set the appropri ate bias for the most accurate temperature and humidity mesasurements Follow the instruc ons below for sr ng temperature and humidity bias K Crea ng a Temperature or Rela ve Humidity Bias If an accep...

Page 18: ...ding Controls are located at the upper le corner of the screen See Figures 25 and 26 below The symbols are similar to the controls of a tradi onal tape recorder for those who may remember tape recorders From le to right the controls are 1 Preview Green Triangle starts chart plot and indicates magnitude of data Data is not recorded it allows adjust ments before recording 2 Record Pressing the Red C...

Page 19: ...sed and measured by the PGA 710B The sensor is mounted in the bo om shell opening of the case for exposure to ambient condi ons It measures temperature and humidity external to the PGA 710B Assuming the PGA 710B is stored in the area overnight it requires only a few minutes for the system to reach op mum performance To display temperature and or humidity check the Show Temperature and Show Humidit...

Page 20: ...ues One needs to define the beginning and end of a set of Minimum and Maximum peaks Every Minimum Peak must have a Maximum Peak a Posi on the Le trim point to define a star ng point for the analysis It should represent an ini al Minimum or Maximum value Referring to Figure 30 the Le trim cursor is placed before a Minimum peak as shown by the circle b Posi on the Right trim point to define the endi...

Page 21: ...remove Min or Max peaks from the analysis a To include a minimum peak in the analysis click Add Min place the cursor over the peak to be included and Le Click your mouse b To include a maximum peak in the analysis cick Add Max place the cursor over the peak to be included and Le Click your mouse c To eliminate a peak from the analysis select Remove place the cursor over the ver cal peak iden fica ...

Page 22: ...rd devia on are added to the average to establish the Highest end of the range c Three mes the standard devia on are sub tracted from the average to establish the Low est end of the range d The Average High and Low ends of each range are iden fied and plo ed on the chart Figure 34 Releasing Data and Process the 3 Sigma Analysis for Minimum Maximum peak sets Figure 35 3 Sigma Ranges are calculated ...

Page 23: ...d and number of peaks iden fied Processed Data is adjusted and Released 3 Sigma Calculated Iden fied VII Genera ng Printed Charts Reports To generate printed charts and reports open the Document drop down menu and select Report View Figure 40 which processes recorded data and provides a new screen view Or press the Report toggle bu on on the tool bar Figure 36 Chart Status Incomplete No Recorded D...

Page 24: ...ure 41 select Body Voltage Genera on A full chart will be displayed Figure 40 Select Report View from the Document drop down Menu or Click Toggle Chart Report View Then choose the desired Report type Figure 41 Selec ng Body Voltage Test or Voltage Test from the Report Menu Gener ates a full size landscape Chart of Test Data ...

Page 25: ...ial Descrip on Loca on Area etc c A performance summary d 3 Sigma analysis of Standing and Walking voltages e Probability analysis of Standing and Walking volt ages 3 To create a fourth page of remarks press Document and select Remarks on the drop down menu Figure 42 All remarks entered in the opened window will appear on the fourth page of the report Figure 42 Select Remarks from Document Menu to...

Page 26: ...s shown in Figure 44 above Selec ng non absolute report format allows the probability curve analysis to employ nega ve and posi ve data Consequently probability curves may be drawn either from Le to Right or Right to Le as shown at the right in Figure 45 Figure 44 Report Pages 3 4 Page 3 displays Probability Analysis based on normal distribu on of Aver age and Standard Devia on informa on for Stan...

Page 27: ...etails may be used for voltage decay measurements For detailed informa on regarding Decay Tes ng refer to the PGA 710B Autoanalysis How to Test Guideline Once a new file is opened decay test data is recorded using the same chart controls described above for recording voltage genera on Short Cut Keys are also used for this func on Open the Edi ng Control Trim window and enter desired decay test par...

Page 28: ...Strip Chart View and the Report View In Report View one may select a full size chart that is produced in a landscape mode or a detailed report produced in the standard portrait mode The decay reports and charts may be generated in a standard format as shown in Figure 52 or in a unique assembled format to compare each decay test cycle Figure 48 Click Analyze to Process Decay Data Figure 49 Use the ...

Page 29: ...red to the Nega ve cycles as shown in Figure 53 For example the total de cay me of all Posi ve cycles was slightly more than 4 8 seconds while the total of all Nega ve cycles is approximately 5 7 seconds Decay tes ng may be adapted to assess a variety of dissipa ve materials and objects including charge movement across materials chairs perform personnel decay analysis as well as assess ioniza on s...

Page 30: ...s 2 Energize both instruments 3 Press the PGA 710B s PAD 2 Start Stop Recording to start recording then commence the test procedure LED s 2 Green 3 Yellow will blink con nuously while recording data 4 A er the test evolu on is complete press PAD 2 Start Stop Recording to stop recording LED s 2 Green 3 Yellow will blink rapidly indica ng recording is stopped and file is ready to be Saved or Erased ...

Page 31: ...t the PGA 710B Autoanalyzer to the com puter and energize both instruments 2 Start the PGA 710B Autoanalysis so ware and se lect Import 3 From Device on the Start Screen as shown in Figure 53 4 Or Open File drop down menu and select Import from PGA 710B See Figure 54 5 Steps 2 4 will open the Import window Click the Read bu on to display all available files for download from PGA 710B by Date and T...

Page 32: ...ng you to name or select the data Target file 3 Once the Excel file is selected click Save and a new Excel file will be created containing all data acquired by the PGA 710B system Data generated by other measurement systems may be imported into the Autoanalysis System Opera ng so ware by way of an Excel spreadsheet Once imported the data can be easily analyzed by the PGA 710B so ware and reports g...

Page 33: ...e 6 Using the T F and Rh entry panels temperature and rela ve humidity can be included with the imported data 7 To highlight and select data to be imported Refer to Figure 60 a Highlight the first Time reference cell and simultaneously press Shift Ctrl and This will highlight all cells containing data in that column b Click the Time Select Range bu on in the Import Window and the me data range wil...

Page 34: ...or click the Toggle Chart Report View 3 Select the export report s file format 4 Provide a target loca on Folder and Drive and new file name 5 Click Save to export the file to its target loca on XI Modifying XML Config File Defaults Various chart color a ributes can be accessed through the XML configura on file located in Program Files applica on program folder Advanced users can modify this file ...

Page 35: ... Figure 62 or 3 In running applica on access View menu and un check Show Start Screen at Startup menu ReportFolder Determines subfolder where report defini ons are stored Unless you know what you are doing never change this se ng UsePrintAppearanceScheme valid values are True and False enables you to use different appear ance schemes for prin ng This op on is set to ON True by default Appearance op...

Page 36: ...chemes Se ngs The Appearance scheme is a set of op ons that determine the appearance of a chart Moreover different schema can be used to display charts on your computer screen and you can use others for prin ng unless you set UsePrintAppearanceScheme described earlier to False The Prostat Autoanalysis Applica ons So ware package is delivered with 5 predefined appearance schemes They are all defined...

Page 37: ...ined here appear in Print Op ons Figure 64 and Appearance Op ons dialog boxes in the ap plica on so ware Scheme Se ngs The names of the entries in scheme defini on are self explanatory The important thing is that each entry is preceded by scheme name For example add key BlackAndWhite BackgroundColor value White defines background color white in this case in BlackAndWhite appearance scheme Figure 6...

Page 38: ...IS MADE IN LIEU OF ALL OTHER PRODUCT WARRANTIES EXPRESS AND IMPLIED INCLUDING MERCHANTABILITY AND FITNESS FOR A PARTICULAR PURPOSE WHICH ARE SPECIFICALLY DISCLAIMED The express warranty will not apply to defects or dam age due to accidents neglect misuse altera ons operator error or failure to properly maintain clean or repair products Limit of Liability in no event will PROSTAT or any seller be r...

Page 39: ...r Ba ery Switch ON unit OFF 8 10mA Unit in standby Panel keypad is energized 2 During Normal Opera ons 108mA Unit is opera ng in remote or computer mode 3 Computer USB Ba ery Charge 100mA Opera ng in computer mode and receiving 100ma current from USB port reduces ba ery drain rate to 8ma 4 Ba ery Charge from AC DC Charger 280mA Charge ba ery with Main ON OFF or during opera ons Temperature Rela ve...

Page 40: ...012 1 GHz Processor 512MB RAM Disk Space 32 bit 850 MB 64 bit 2 GB 800 x 600 or higher resolu on display with 256 colors Microso DirectX 9b Instrument input limits to 2 volts Note Providing over 2 volts to the PGA 710B Autoanalyzer will void the warranty For appropriate adapters or cables please contact Prostat Corpora on or your Prostat Authorized Reseller ...

Page 41: ...NOTES 41 Rev E October 4 2018 PGA 710B Autoanalysis System ...

Page 42: ...NOTES 42 Rev E October 4 2018 PGA 710B Autoanalysis System ...

Page 43: ......

Page 44: ...enville IL 60106 630 238 8883 Fax 630 238 9717 1 855 STATIC1 www prostatcorp com Prostat Corpora on Specifica ons are subject to change without no ce All Prostat trademarks and trade names are the property of Prostat Corpora on All other trademarks and trade names are the property of their respec ve companies ...

Reviews: