Using the Composite Railway-Insulator Tester & Software
46
5.4
AFTER Testing Sessions
5.4.1 Displaying Graphs
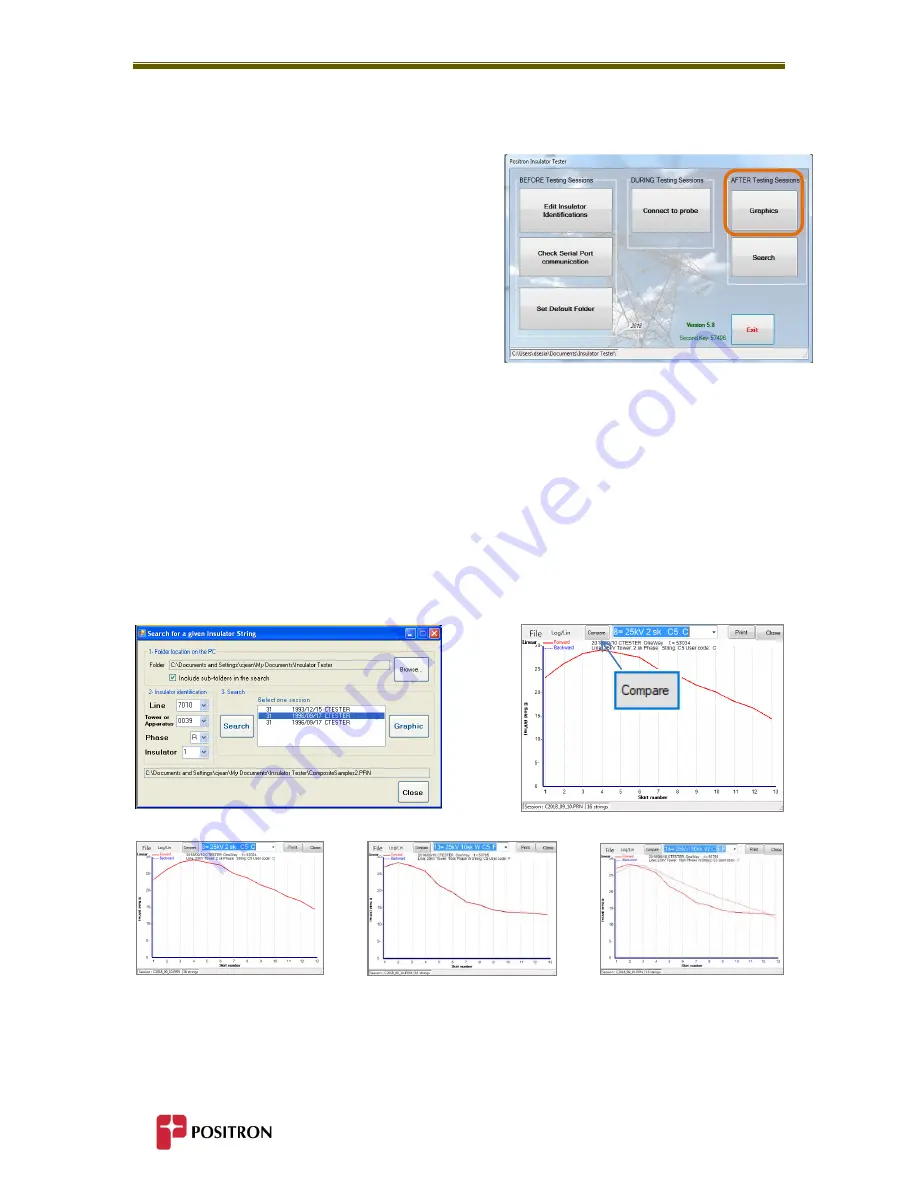
At any time before, during or after a testing session,
press the “Graphics” button on the Tablet screen to
display the graphs from the data stored in the
Tablet/Laptop. Refer to Chapter 6 for interpretation
of the graphs.
5.4.2 Searching the Database
Search
a database for a given insulator in the database to evaluate its degradation over time.
See Section 6.6 for a description of superimposed graph comparison.
To
search
for an insulator:
Browse and select the “
Search
” button from the menu of the Insulator Tester Software,
Select the folder (and optionally all its subfolders)
then choose an insulator
display the chosen insulator
select the next insulator
display its graphic and reduce its opacity to superimpose many graphics
the degradation over time becomes evident
One graph superimposed on another using the
Compare
feature
+
=
Summary of Contents for 3782101C/50
Page 2: ......
Page 4: ......
Page 7: ...1 Chapter 1 General Information ...
Page 8: ...General Information 2 ...
Page 11: ...5 Chapter 2 Overview ...
Page 12: ...Overview 6 ...
Page 17: ...11 Chapter 3 Composite Insulator Tester Elements ...
Page 18: ...Composite Insulator Tester Elements 12 ...
Page 24: ...18 ...
Page 25: ...19 Chapter 4 Windows Based Software ...
Page 26: ...Windows Based Software 20 ...
Page 29: ...23 Chapter 5 Using the Composite Insulator Tester Software ...
Page 30: ...Using the Composite Railway Insulator Tester Software 24 ...
Page 54: ...48 ...
Page 55: ...49 Chapter 6 Interpreting Graphic Results Electric Railway Application ...
Page 56: ...Interpreting Graphic Results Electric Railway Applications 50 ...
Page 64: ...58 ...
Page 65: ...59 Chapter 7 Specifications ...
Page 66: ...Specifications 60 ...
Page 68: ...62 ...
Page 69: ...63 Chapter 8 Important Information ...
Page 70: ...Important Information 64 ...


