24 / 80
System Menu – Graphical Statistics
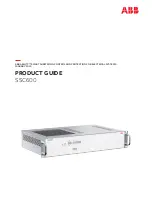
Graphical Statistics
: On this page, you can
view the charts including real-time traffic
statistics of Top 10 managed APs and active
clients.
The
Top 10 Managed AP
chart shows the real-time traffic
statistics of Top 10.
Switch between 1 day and 1 week to view the statistic of a
day in 24 hrs, or cumulative traffic including 7 days of a
week.
Click the AP name at the x-axis of the top chart to show the
statistics of designated APs shown in the bottom chart.
Move the cursor on any
arrow point to view the hint
of the AP status.
[Bottom Chart]
[
Top Chart]
[System Menu – Graphical Statistics]
Summary of Contents for NMS-500
Page 1: ...NMS 500 Quick User Guide ...
Page 4: ...4 80 Application ...
Page 5: ...Before First Login ...
Page 6: ...6 80 Front Rear Panels ...
Page 8: ...8 80 Device Setting Figure 1 Figure 2 ...
Page 9: ...9 80 Device Setting Figure 3 ...
Page 11: ...11 80 Logging in UNI NMS Username admin Password admin ...
Page 12: ...Setup Wizard ...
Page 17: ...Main UI Introduction ...
Page 18: ...18 80 Home Page Dashboard UI Structure A B C D E F ...
Page 20: ...Dashboard Introduction ...
Page 23: ...System Menu Graphical Statistics ...
Page 26: ...System Menu Domain ...
Page 35: ...System Menu AP Control ...
Page 49: ...System Menu Refresh ...
Page 51: ...System Menu System Configuration ...
Page 55: ...55 80 System Menu Network Services Port Statistics information ...
Page 59: ...System Menu Network Services ...
Page 62: ...62 80 System Menu Network Services Client List information ...
Page 65: ...65 80 System Menu Network Services SNMP Trap Configuration ...
Page 68: ...68 80 System Menu Network Services RADIUS Client Setting Finished ...
Page 70: ...70 80 System Menu Network Services RADIUS User Account Setting Finished ...
Page 71: ...System Menu Maintenance ...
Page 76: ...System Menu Exit ...
Page 80: ...80 80 ...