


PicoVNA 106 6 GHz Vector Network Analyzer
29
© 2017 Pico Technology
pv106ug r1
The
colors
of the main graphics display can be changed to suit individual preferences. This can be done by
selecting the
Color Scheme
item from the
Tools
menu. To set a color, click the color preview box next to
the item name.
Once you have set up a color scheme, you can save and recall it as a
Cal and Status
setting using the
File
menu.
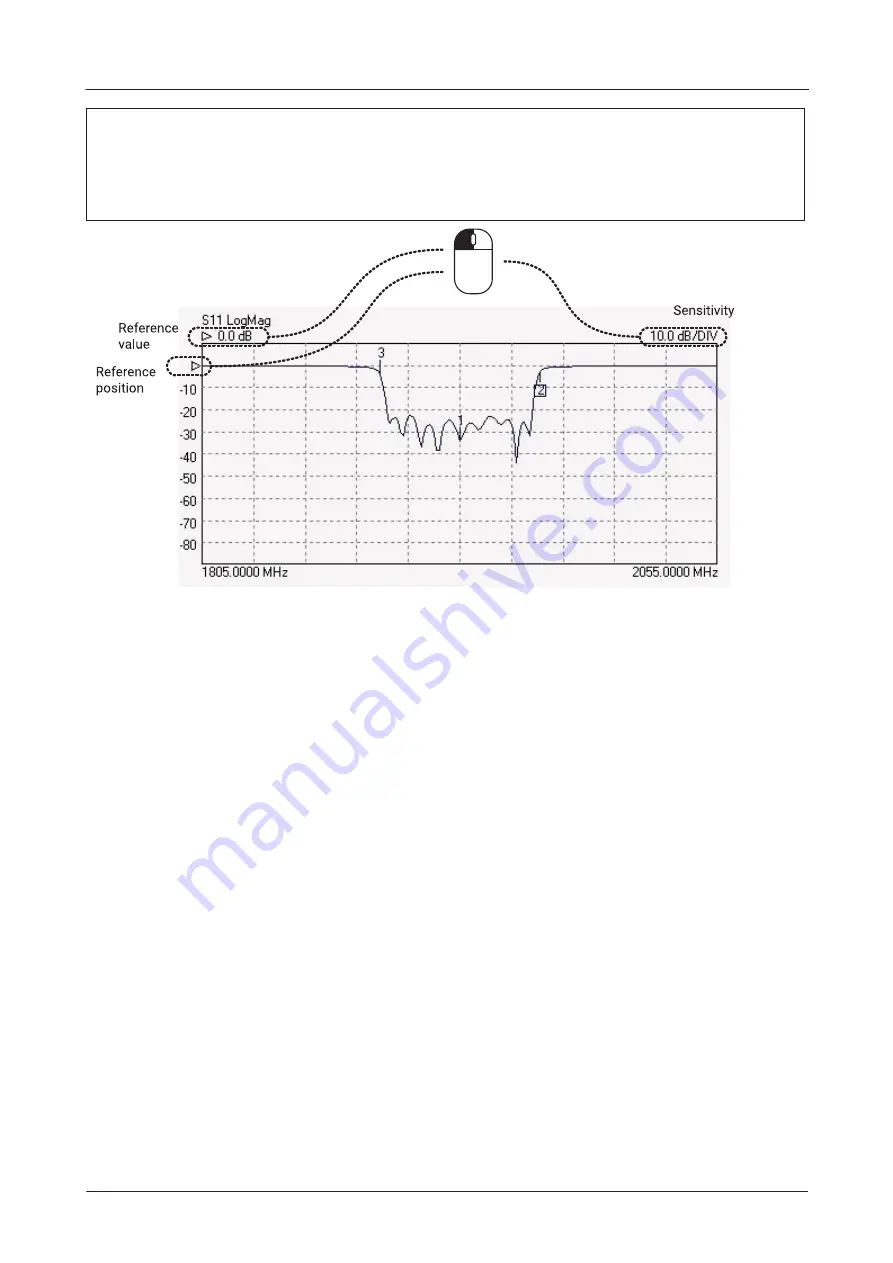
Editing graph parameters using the mouse
The figure above shows how the mouse can be used to quickly adjust reference position, reference value
and vertical scale sensitivity.for the graph. Drag the indicated values up and down to adjust, or type a new
value where the cursor indicates.
6.1.2
Data markers
It is possible to display up to eight markers on each display. They are set up by clicking on the
Markers
button (see figure below). There are four possible marker modes as follows:
Active marker:
The active marker is the marker used for comparison when the delta marker mode (switched
on by selecting a reference marker) is on. One of the displayed markers must be chosen as the active
marker.
Reference marker:
The reference marker causes the delta marker mode to be switched on. The value
difference between the active marker and the reference markers is shown on the right hand marker display
panel.
Fixed marker:
A fixed marker cannot be moved and its position is not updated with subsequent
measurement values. It provide a fixed reference point. Only a reference marker can be made a fixed
marker. Once a marker is fixed, it cannot be moved until it is unfixed.
Normal marker:
The value of a normal marker is displayed on the right-hand marker readout panel and in
lower resolution readouts below each measurement plot.
Any marker (except a fixed marker) can be moved to a new position by left clicking on it (on any displayed
channel) and dragging it to a new position.


