Tracing with common IDEs
QT
RACE
-
U
SER
M
ANUAL
© 2018 PDQLogic Ltd.
QTrace User Manual Rev 1.01
Page 49
12.
Tracing with common IDEs
Although every IDE performs the same basic functions, each one has a different way of interacting with
the target. This section details how to configure the debugger scripts supplied with the QTrace Analyser
for a number of common IDEs.
12.1
Location of debugger scripts
The QTrace Analyser debugger scripts that are used to configure trace are installed in the following
folder:
C:\Users\Public\PDQLogic\QTraceAnalyser\Debugger Scripts\
<IDE>
Where
<IDE>
is the name of a particular IDE
Note
:
For all IDEs, any trace options should be disabled (this is typically the default for a new configuration).
12.2
Example Projects
For each IDE detailed in the following sections there is a corresponding example project that is installed
with the QTrace Analyser. Each project is built around the same core functionality which implements a
USB FLASH disk application for the STM32-Eval demonstrator board (see Appendix B STM32-Eval
Demonstratorfor details). This board is part of the QTrace-STM32Eval kit or can be purchased separately,
see
www.pdqlogic.com
.
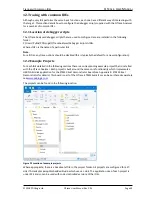
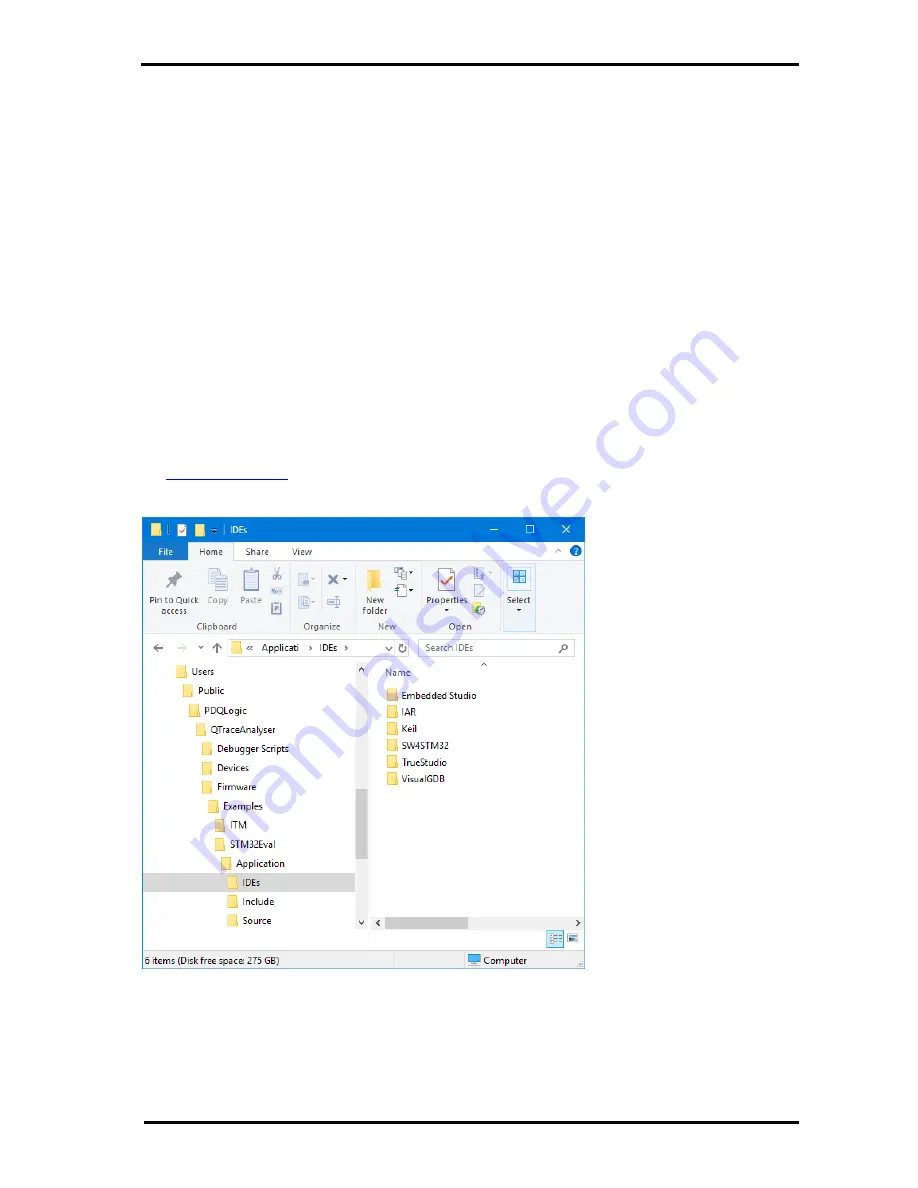
The projects can be found in the following location:
Figure 52 Location of example projects
Where appropriate, there is a Readme.txt file in the project folder. All projects are configured for a ST-
Link JTAG adapter except Embedded Studio which uses a J-Link. The application size of each project is
under 32K and so can be used with code size limited versions of the IDEs.


