Trace Start Sequence
QT
RACE
-
U
SER
M
ANUAL
© 2018 PDQLogic Ltd.
QTrace User Manual Rev 1.01
Page 43
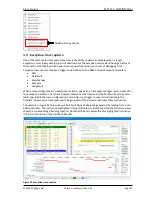
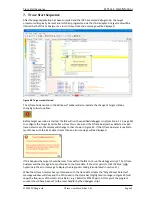
Figure 49 QTrace Analyser configured and ready to trace
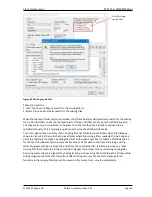
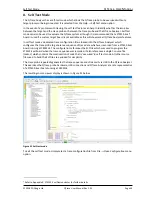
When the target is commanded to run by the IDE, it will start streaming trace data which the QTrace
Analyser will decode and display. The CPU speed and coverage in the status bar will be updated to
reflect their new values.
Figure 50 QTrace Analyser tracing
The QTrace Analyser icon in the Windows Taskbar will also indicate that trace data is being streamed
from the target by changing colour to green:
At this point trace is running normally and all QTrace Analyser features will be active.

