


E--883--4N--E
1
7. CALCULATION FORMULAS
7.1 Implementation of Meter Error Correction (Total flow before correction)
Q
1
= a
×
Ip
×
(1 + E/100)
where Q
1
: Total flow corrected for meter error
[
l
]
a: Meter factor
[
l/P
]
Ip: Number of input pulses
E: Meter error correction value
[
%
]
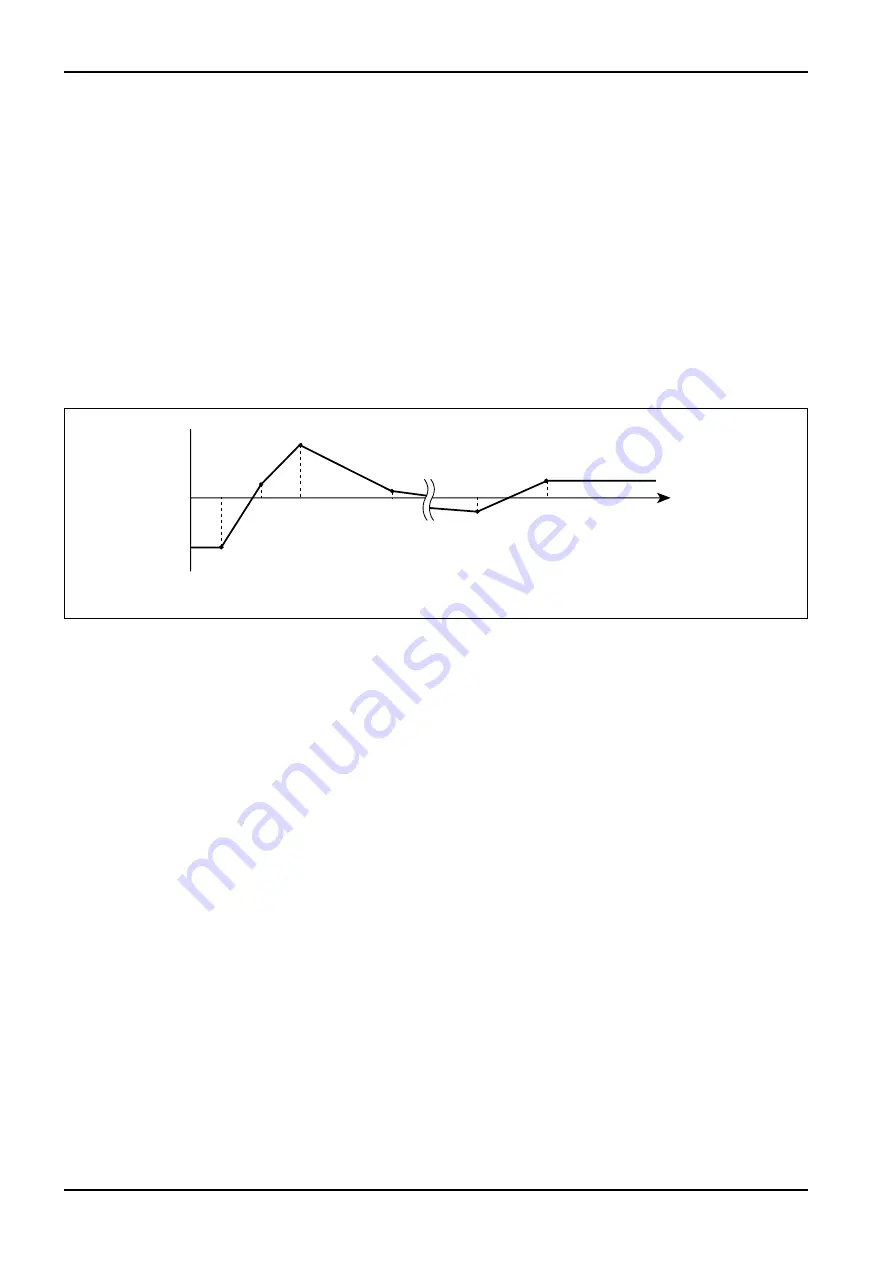
The line graph in Fig. 7.1 below shows how meter error curve linearization is achieved. E is
approximate-ly determined by the relationships between input pulse frequency and instrumental
error correction value set at multipoint error points which are programmable along the flowmeter's
instrumental error curve with front-panel keys, and the frequency pulse information (flowrate)
7.2 Implementation of Temperature Correction (Corrected total flow)
Q
2
= Q
1
×
K
K = {a + b
・
(t
0
−
t) + c
・
(t
0
−
t)
2
}
where Q
2
: Total flow corrected for temperature
[
l (normal)
]
Q
1
: Total flow calibrated for meter error
[
l
]
K: Temperature correction factor
t
0
: Reference temperature
[°
C
]
t
: Line temperature
[°
C
]
a thru c: Correction factors
7.3 Instant Flowrate (Uncorrected)
Q
m
= a
×
f
×
(1 + E/100)
×
3600
where Q
m
: Instant flowrate corrected for meter error
[
l/h
]
f: Input pulse frequency
[
Hz
]
7.4 Instant Flowrate (Corrected)
Q
mc
= Q
m
×
K
where Q
mc
: Instant flowrate corrected for temperature
[
l/h (normal)
]
+
0
−
F
1
F
2
F
3
E
1
E
2
E
3
E
4
F
4
F
8
E
8
E
F
9
}
9
Fig. 7.1
F
1
thru F
9
Frequency (Hz)
E
1
thru E
9
Meter error correction value (%)
Meter error
Flowrate
(frequency)
Programmable with keys


