USING OPTOENET PID MODULE TUNER SOFTWARE
SNAP PID Module User’s Guide
13
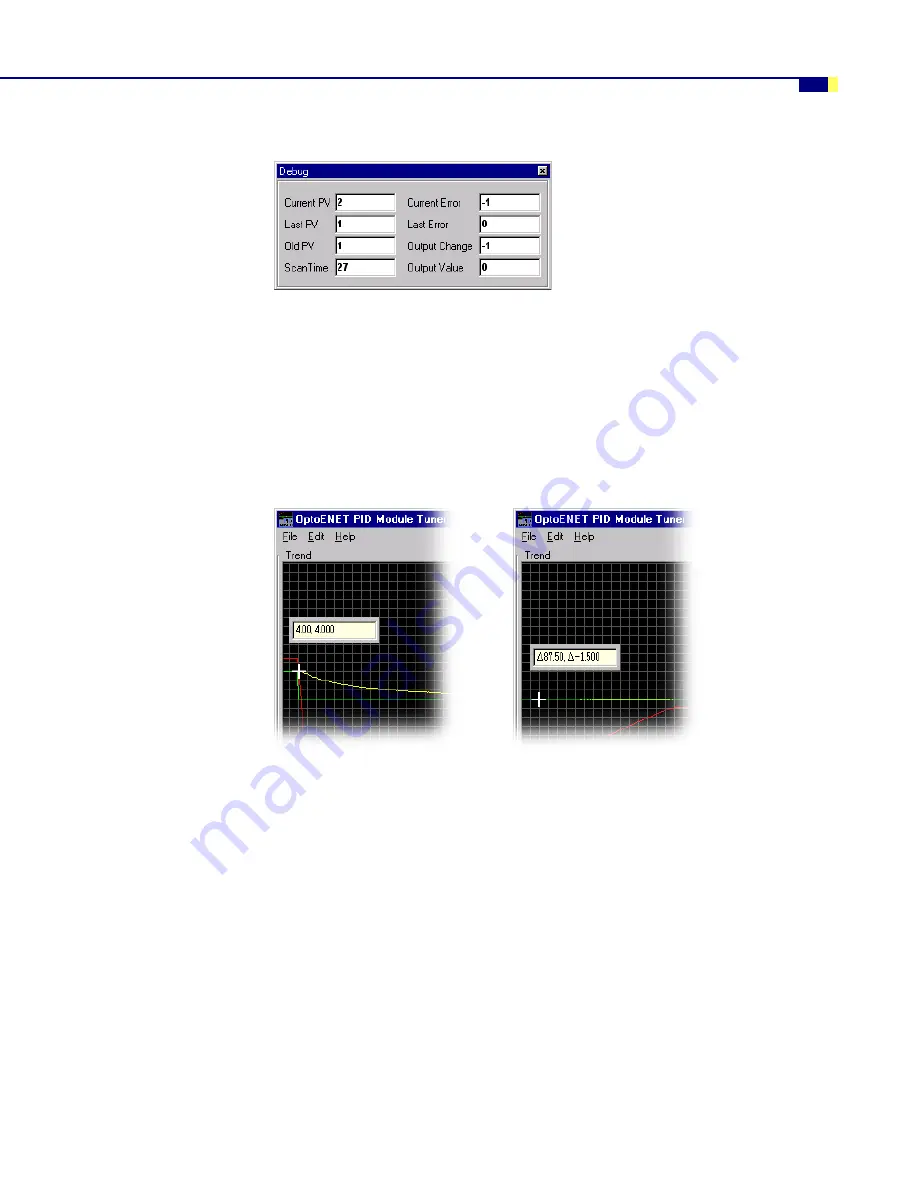
The Debug window appears.
Step 4—Optimize PID Loop
1.
Observe the graphed process variable (input), setpoint, and output values on the chart.
2.
To see the coordinate values for a point on the graph, just click on that point.
Coordinate values appear near the cursor. To measure distances between two points, click
on the graph and then drag the mouse. Measurements will appear near the cursor.
Examples of viewing coordinate values and measuring distances appear below.
3.
Enter new P, I, D, and SP values in the Tuning Parameters section if necessary, and then
click Apply.
4.
Continue to observe the graphed values and change PID values until the PID loop is
optimized.
5.
If you need to adjust PID loop scan time, base time, or the limit values you set earlier, do
the following:
a.
Click Manual Mode to stop PID calculations.
b.
Click Options.
c.
Change values in the Limits and Configuration sections as needed.
d.
Click OK.
e.
Click Auto Mode to start PID calculations again.
Coordinate values
Distance measurement


