18
optics11.com
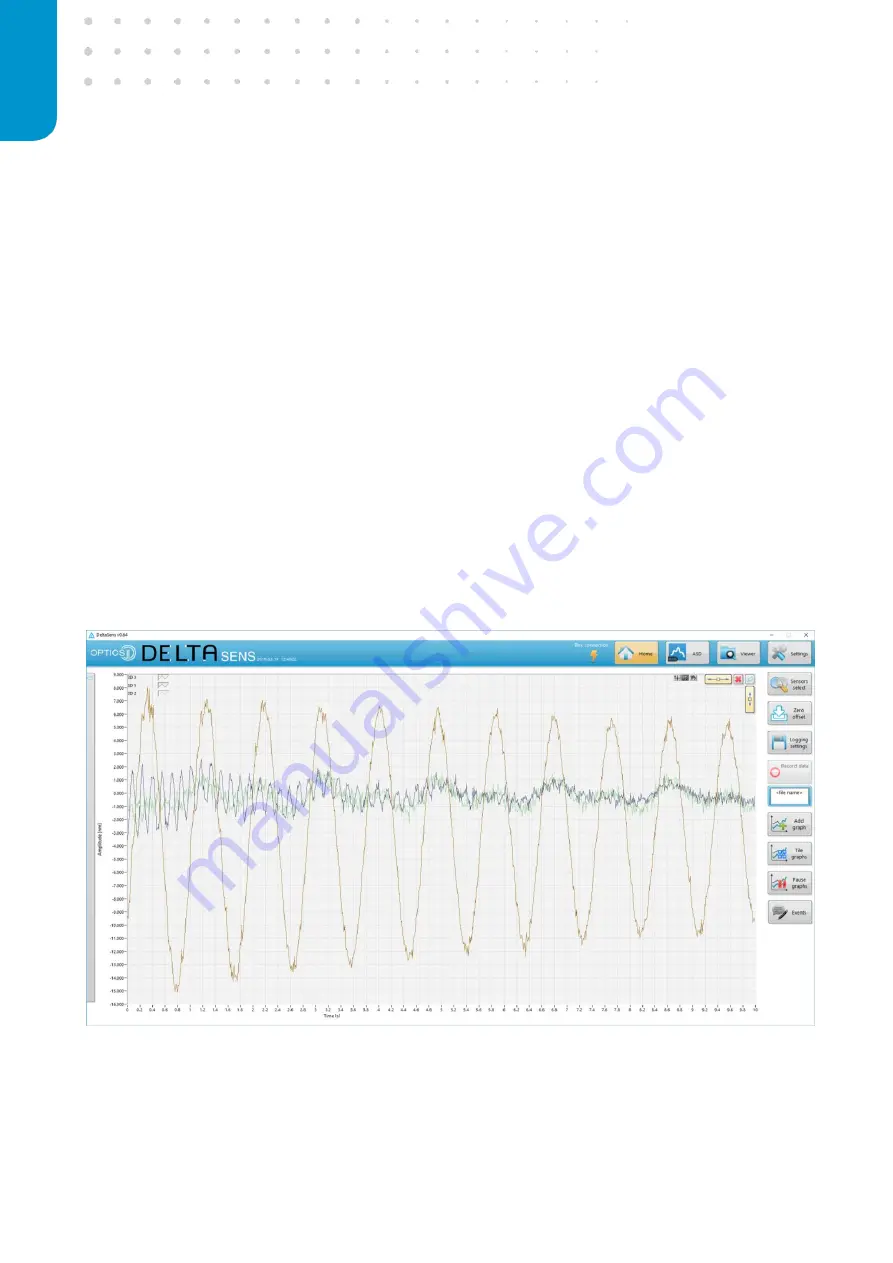
-
Logging settings
–
opens a window that allow the user to set data logging preferences such
as file location and acquisition length. It is described more in detail in section 1.5.
-
Record data
–
allows the user to launch the data acquisition. From the moment this action
button is activated the program will follow the settings specified in
the “Logging settings”
menu and record the signals acquired by the unit.
-
File name
–
allows the user to specify a name for the recorded data to save. This name will
be concatenated with a time stamp indicating the date and time of the acquisition.
-
Add graph
–
allows to add a new graph to the Home and ALD panels. The software can display
up to 12 graphs at the same time and each graph can display all the currently demodulated
sensors or part of them depending on the user needs.
-
Tile graphs
–
automatically arranges the currently displayed graphs in a default tile pattern.
-
Pause graphs
–
freeze the graphs to allow the user to zoom and look into the data. This action
button does not stop the signal acquisition and data logging which will continue in
background. By unpausing, the graphs will update to their current state.
-
Events
–
opens the events log window which lists any command sent to the box as well as
warnings and errors. If there is any warning listed in the log flow, the
“Event”
button will turn
orange and red in case of an error.
Figure 10: Home panel displaying a graph