4
5
Various Screen Functions
Various Screen Functions
Control Screens
Up to eight tags can be allocated. By
allocating tags, it is possible to display
faceplates based on the function. The loop
status can be monitored and controlled in
the faceplate.
Trend Screens
Control Block values such as the SP and MV
can be displayed as a trend graph. There
are three kinds of trends: realtime trends,
historical trends, and batch trends. And up
to 8 trends can be displayed in one Trend
Screen. The collected data can be saved
automatically or manually in CSV format.
The defined trend points can be changed,
deleted, or added offline.
Tuning Screens
Tuning Screens display the parameters that
can be tuned in faceplates and trend graphs
displaying the PV, SP, or MV. Parameters
can be adjusted while monitoring operation
in the trend graph in 1-second intervals.
Other Screens
Other helpful screens are provided, such as
System Monitor Screens, Annunciator
Screens, and Operation Guide Message
Screens. System Monitor Screens can
display the status of the CPU and Loop
Controller as well as the error status of
Blocks. Annunciator Screens can display up
to 16 alarm displays per screen. Operation
Guide Message Screens can display
messages that were registered in advance
by the user.
Alarm Log Screens
The Alarm Log can be displayed in
historical order. Alarms resulting from
deviation alarms or bit status can also be
displayed in the Alarm Log, in addition to
the Control Block's HH, H, L, and LL alarms.
Operation Log Screens are also available to
sequentially display values manipulated
from Control Screens, Tuning Screens, or
Graphic Screens.
Version 2.0 or Higher
Version 2.0 or Higher
Version 2.0 or Higher
Function Upgrades
Function Upgrades
in CX-Process Monitor Plus
Version 2.0
in CX-Process Monitor Plus
Version 2.0
Function Upgrades
Function Upgrades
in CX-Process Monitor Plus
Version 2.0
in CX-Process Monitor Plus
Version 2.0
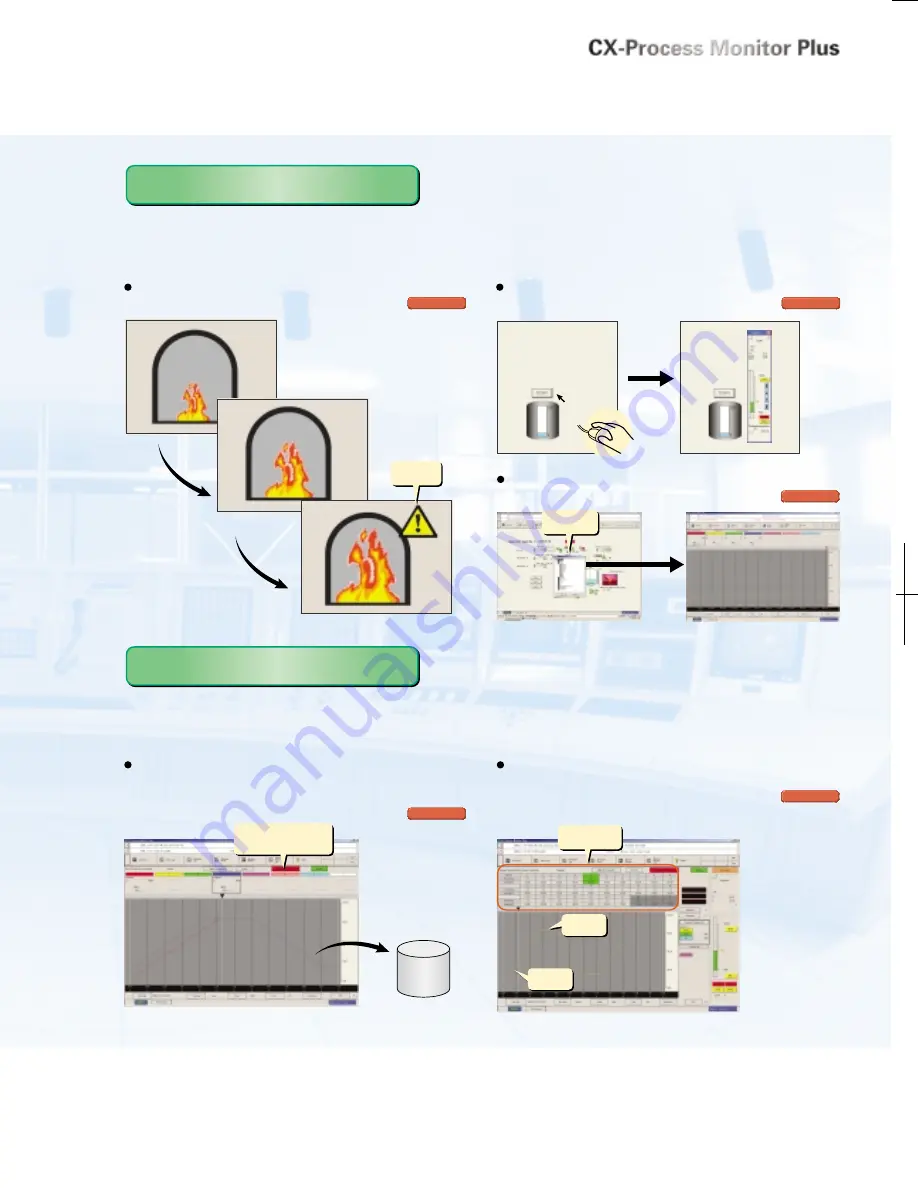
Images can be changed, displayed, hidden, or made to
flash based on the values of tags (data).
A Faceplate Button can be set up to display a faceplate
in a Graphic Screen.
A screen jump element can be set up to easily switch
screens.
Value: 20
Automatically saved.
Value: 50
Value: 80
CX-Process Monitor Plus Functions
Move to
selected
screen.
Screen selection
dialog box
SP
Segment Program
2 settings
PV
Click
Display/Hide
switch
A Wide Variety of Screens Is Available, and PLC-based Process
Control Systems Can Be Constructed Flexibly and Inexpensively.
With the Upgraded Graphic Functions, It Is Easy to Configure
the Monitoring Screens Needed for the Overall System.
With the Upgraded Trend/Segment Functions, It Is Easy to Read
Changing Analog Values.
The CX-Process Monitor Plus can be used to import tag data (CSV file format) of the function blocks in a Loop Controller,
and easily create screens such as Control Screens (on-site instrument images), Trend Screens, Graphic Screens, and
Annunciator Screens.
Graphic Screens
Dynamic symbols (elements that change with
the tag's value), such as valves, pumps, and
numerical values, can be allocated freely.
Lines, rectangles, and ellipses can also be
drawn, the color of those elements can be
changed, and the elements can be made to
flash. Static symbols or bitmap images
created in standard graphics software can be
read as images and displayed.
Version 2.0 or Higher
Version 2.0 or Higher
Use a specified tag (data) value to start or stop data
collection in a Batch Trend Screen. It is also possible to
automatically save past data, read that past data, and
superimpose it on the chart.
The PV trend can be displayed against the SP by setting
the segments in table format in the Segment Program 2
Screen.
Start data collection with a
screen operation or a data-
collection status trigger.


