Product User Guide | 17
OM-CP-OCTPRO
VIEWING DATA
Real-Time Data
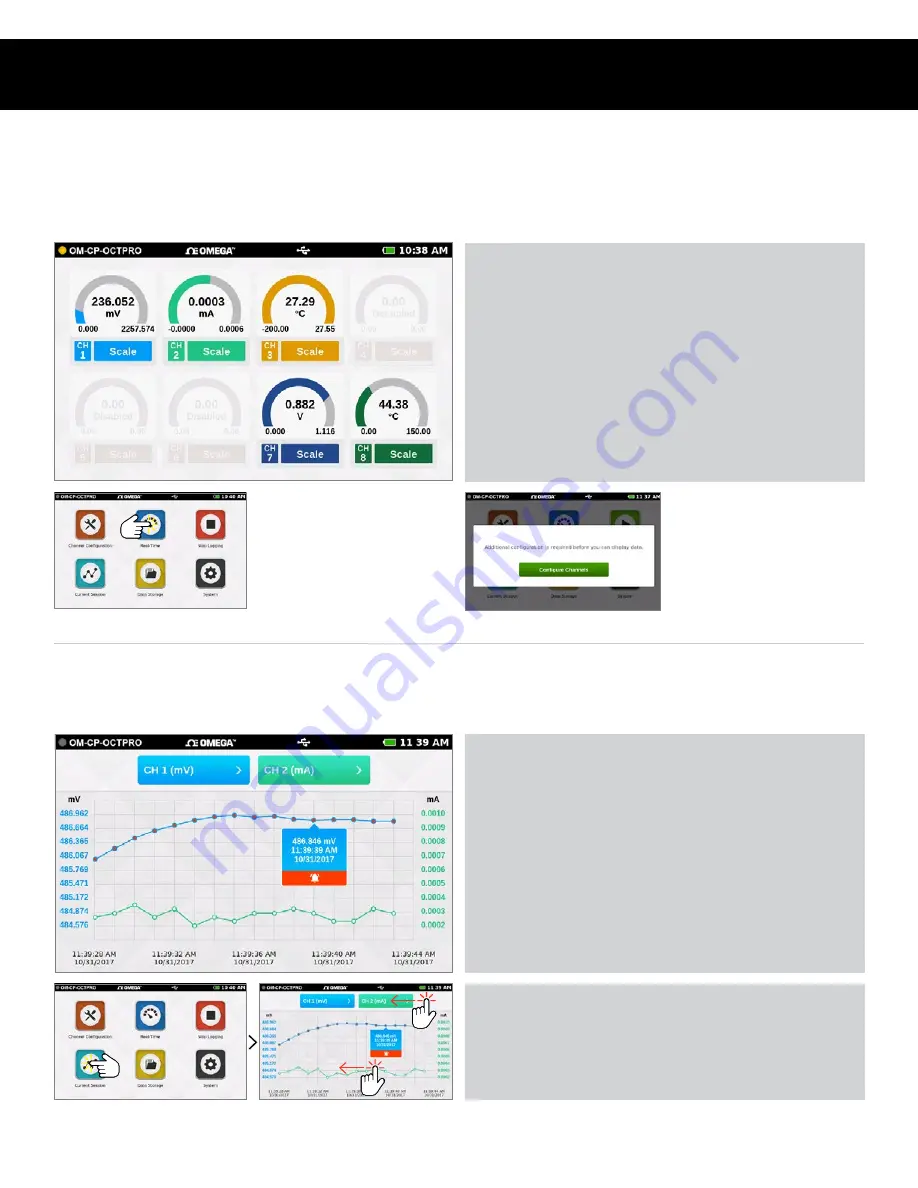
When Real-Time is selected from the Home screen, the device will display data from all enabled channels and update at the user
selected reading rates. The Real-time view is also available from the Current Session menu when the device is actively logging.
Current Session — Graph View
Select the Current Session button from the Home screen to view the recorded data in various formats, swipe the screen to the left or
right to navigate.
Configuration Warning
Real-Time data is only
available if the device
channels are configured.
Swipe Options
• Swipe left at the top of the screen to go to the tabular
data view.
• Swipe within the graph to scroll through the graph timeline.
• Current Reading:
Displayed in the center of the gauge.
• Minimum:
Displayed on the bottom left of each gauge.
• Maximum:
Displayed on the bottom right of each gauge.
• Zero:
(Pulse Only) Resets the displayed reading to zero.
• Scale:
Scales the readings on the screen. Maximum
value will be reset to the current value.
Graph View
• Use the drop down menus at the top to select which
channels to view.
• Touch any point on the graph line to display more
detailed information.
• Triggered alarm events will be visible within the graph.
Select Real-Time
Select Current Session
Swipe to Navigate


