


15
Edit Menu Functions
Clear Spectrum Overlays
Select
Edit | Clear Spectrum Overlays
from the menu to remove static spectra from the graph.
Clear Kinetics Values
Select
Edit | Clear Kinetics Values
from the menu to clear both the kinetics values from the chart and
to clear the kinetics traces. A message box then appears, asking if you are sure you want to clear the
kinetics chart.
Autoscale X
The
Autoscale X
function automatically adjusts the horizontal scale of a current graph so the entire
horizontal spectrum fills the display area.
Autoscale Y
The
Autoscale Y
function automatically adjusts the vertical scale of a current graph so the entire vertical
spectrum fills the display area.
Show Kinetics Values
When setting up your kinetics experiment, you
must first select
Spectrometer | Spectrometer
Configuration
from the menu and make sure that
Spectrum & Kinetics
is selected next to
Graph and
chart display mode
. Then configure your experiment by selecting
Spectrometer | Kinetics
Configuration
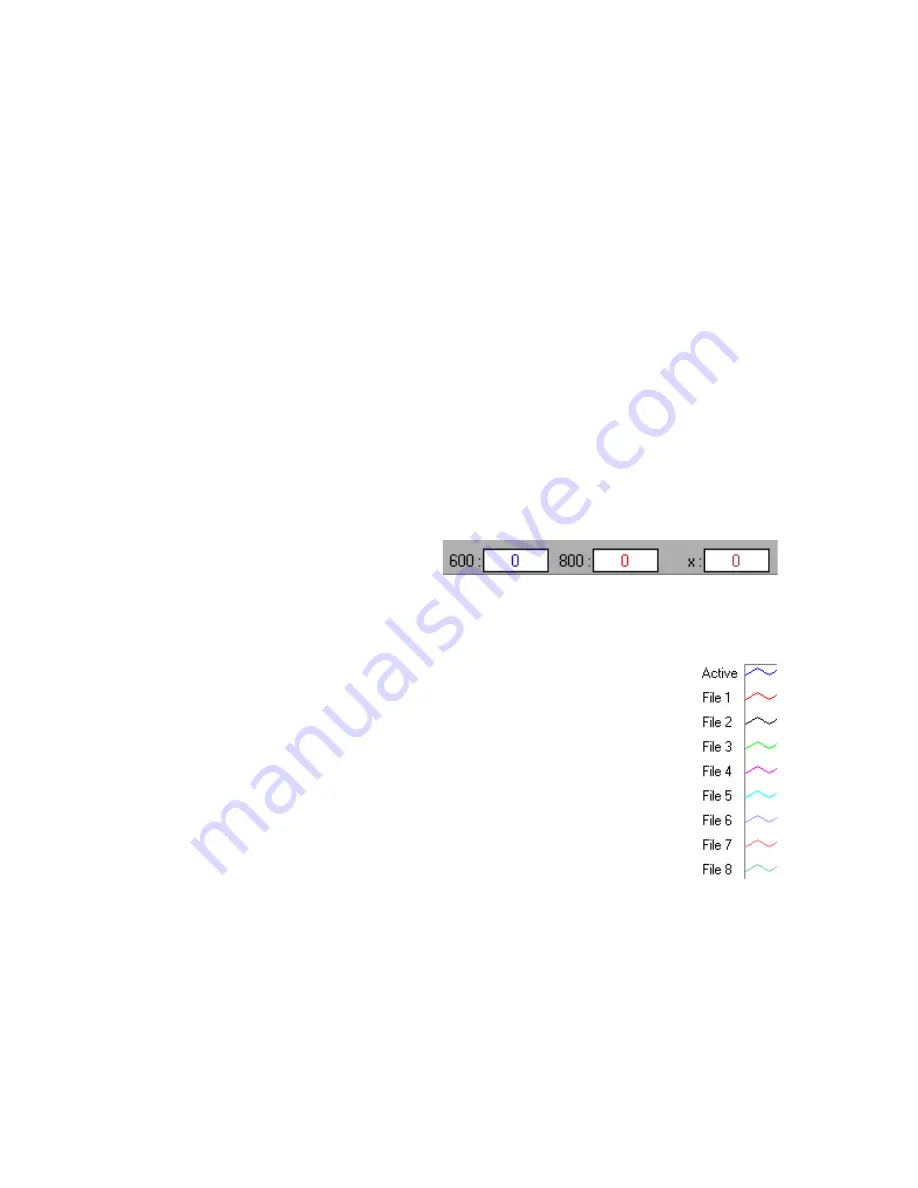
from the menu. When you select your wavelengths, the values from these wavelengths
will be displayed above the kinetics chart if this function is enabled.
Show Legends
Select
Edit | Show Legends
to enable or disable the legends for the spectral trace,
overlays, and kinetics traces. When the legends are displayed, you can opt to configure
the traces by simply clicking on the legend trace you want to configure. You have the
opportunity to choose from several aesthetic functions such as: the plot design of the
spectrum, the point style used in the spectrum, the line style and width desired, color of
the plot, and a bar plot design. You can also choose to fill the baseline in the spectrum.
Utilize this function to differentiate one spectral trace from another.


