Quick Start Appendix
APconnections, Inc. // 303.997.1300 //
www.netequalizer.com
Page 12 of 14
All rights reserved
Copyright © 2010 to 2015 APconnections, Inc.
rev. 20141125
Appendix #1: Viewing Traffic
Once the NetEqualizer is inline on your network, you can view what is happening in several ways:
Dynamic Real-Time Reporting (RTR)
One of the things that has always differentiated the NetEqualizer from other monitoring and shaping tools
is that
we have the actual data for every user accurately updated by the second
. Thus, we are able to
make shaping decisions based on usage every second. We now display this data in Dynamic Real-Time
Reporting (RTR), a new capability imbedded within the NetEqualizer Dashboard. With RTR, you will be
able to slice and dice network usage and network process data in
more meaningful ways, to help you better manage your network.
From the Dashboard,
Click on ->[
Dynamic RTR
].
The Reports Menu at right will be displayed. From the Reports Menu,
click on ->
Active
Connections
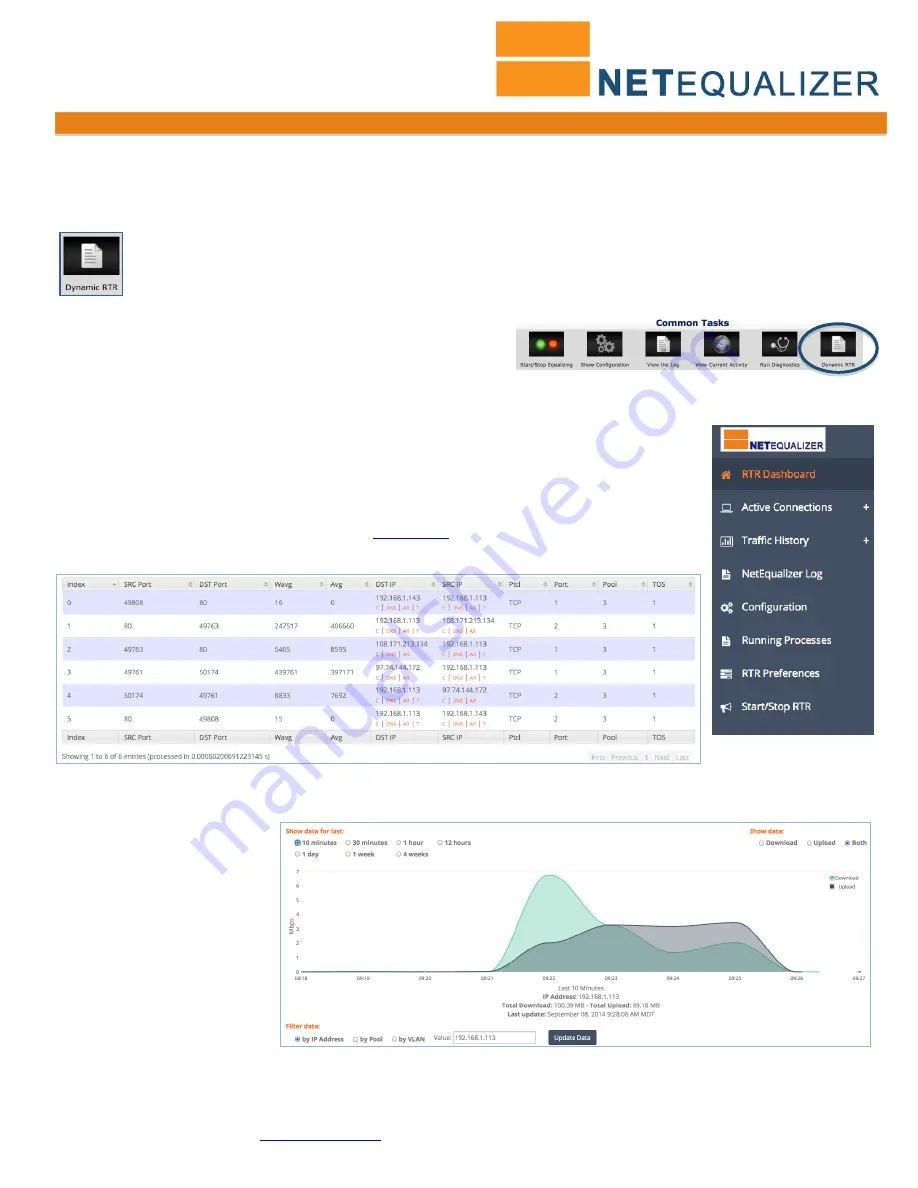
to see a live look at the BRAIN table of the NetEqualizer. Active Connections is
sortable and searchable, so that you can focus on the connections you are most interested in
viewing. Use this to easily find bandwidth hogs by sorting on Wavg and displaying largest to
smallest (descending). You can also search by any IP address to view all traffic for any
particular user by IP. You can also click on the links below any IP address to view associated IP
Reports. Read more about these reports in our
User Guide
.
Active Connections Table
Traffic Trends & History
You can view traffic graphs by
IP, VLAN, Pool, or your entire
network, to see bandwidth
usage at this moment or in time
intervals up to 4 weeks.
Click on ->
Traffic History
to
select a Traffic Graph. In the
example at right, you can see
download and upload usage for
192.168.1.113 over 10 minutes.


