background image


 24 

www.national.com  


12.0 Appendix C - Using WaveVision Plots 


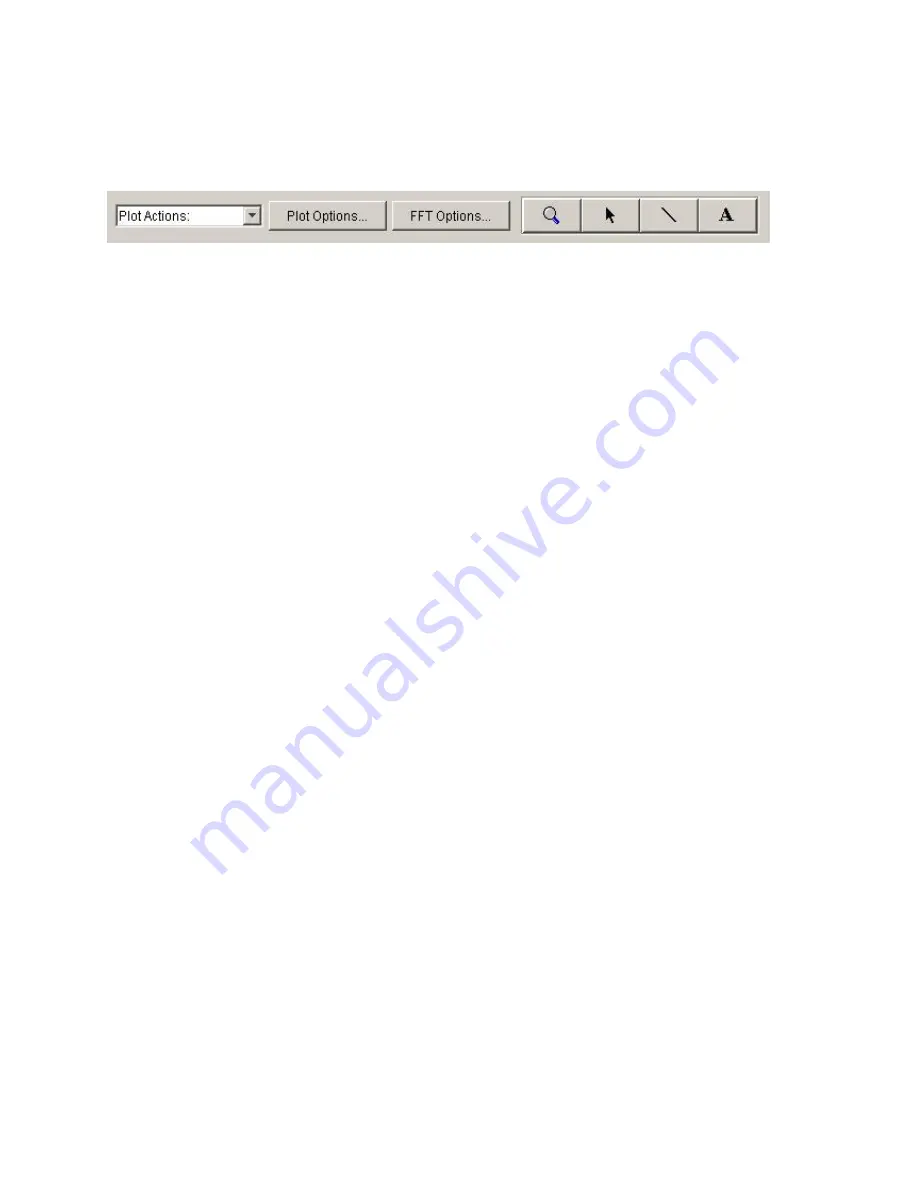
The WaveVision software provides several tools to help you interact with plots.  A toolbar appears above 
each plot, similar to Figure 4. 


Figure 4: WaveVision Plot Tools


Seen from left to right, the following tools are available: 
 

Plot Actions menu:

 This menu contains commands that pertain to this particular plot.  You may export 

the plot data to a file, print the plot, save it as a graphic, or change the plot’s colors. 
 

Plot Options

: This button opens a dialog box with options that pertain to this particular plot.  You may turn 

off labels, annotations, or other elements in this dialog.  The WaveVision software maintains default 
options for new plots.  You may edit the default options by choosing 

Default Plot Options

 from the 

Settings

 menu. 


FFT Options: 

The toolbar shown in Figure 4 is from an FFT plot, and thus contains a button to edit the 

options for the FFT calculation.  Depending upon the type of plot, various options may be present on the 
toolbar.  Please consult the appropriate section below for more information about these options. 
 

Magnifying glass tool:

 This tool allows you to zoom in and out to see fine details in the plot.  Click and 

drag a box from upper-left to lower-right to zoom in on a particular region of your plot.  Click and drag a 
box from lower-right to upper-left to zoom out.  

With the magnifying glass tool selected, click the right 

mouse button to return to a normal, 100% view. 
 
Arrow Tool: 

The arrow tool is used to select, move, and edit annotations.  To edit an annotation, double 

click it with the arrow tool.  To delete an annotation, select it with the arrow tool and press the 

Delete

 key 

on your keyboard. 

 
Line Annotation Tool: 

To draw lines on the plot, select this tool.  Drag to draw new lines.  To add 

arrowheads, or fix the endpoints of the line, double-click it with the arrow tool. 
 

Text Annotation Tool:

 To draw labels on the plot, select this tool and click at the desired location in the 

plot.  To edit the justification, location, or text of an annotation, double-click it with the arrow tool. 

The Waveform Plot 

 
The Waveform plot shows you the raw samples collected from the hardware.  This plot is mainly used to 
verify the integrity of collected data – the waveform is the best view in which to diagnose a distorted signal, 
an irregular clock, a low-amplitude signal, and many other common ADC system problems. 
 
The Waveform plot also quickly shows you how much of the ADC’s dynamic range your signal occupies. 

The FFT Plot 

 
The WaveVision software automatically computes a Fast Fourier Transform (FFT) of the sample set, and 
displays the results in an FFT plot.  The FFT plot is, in many respects, the heart of the software.  The FFT 
shows you the frequency content of your input signal.  It marks the fundamental frequency, and a 
selectable number of harmonics. It also labels their order and frequencies.  It shows the power in the 
fundamental and harmonics.  Try hovering your mouse cursor over a harmonic to get information about it. 
 
The FFT can be used to diagnose common ADC problems such as input spectral impurity, clock phase 
noise, and clock jitter. The FFT plot also shows several statistics on the quality and purity of the collected 

Summary of Contents for ADC081500DEV

Page 1: ... 24 2006 Revision A Development Board Instruction Manual ADC081500DEV Single 8 Bit 1 5 GSPS 1 2W A D Converter with Xilinx Virtex 4 XC4VLX15 FPGA Copyright 2006 National Semiconductor Corporation ADC081500DEV Development Board ...

Page 2: ...9 7 4 Schematic Drawing ADC081500DEV Power Supplies 1 10 7 5 Schematic Drawing ADC081500DEV Power Supplies 2 11 7 6 Schematic Drawing ADC081500DEV Expansion Header Interface 12 8 0 Bill of Materials Page 1 of 2 13 8 1 Bill of Material Page 2 of 2 14 9 0 Using the Wavevision4 software with the ADC081500DEV 15 9 1 Getting Started 15 9 2 Control Panel 17 9 3 Serial Control Mode 19 9 4 Capturing Wavef...

Page 3: ... board and the system also allows an external clock to be used if alternative sample rates are required The ADC connects to a Xilinx Virtex4 FPGA which stores up to 4K of data from each channel before transferring it through the USB interface to the PC 2 0 Board Assembly The ADC081500 Development Board comes in a low profile plastic enclosure and requires no assisted cooling due to its low power c...

Page 4: ...click the FFT Tab 4 0 Functional Description The ADC081500 Development Board schematic is shown in Section 7 0 4 1 Input circuitry The input signal s to be digitized should be applied to the front panel SMA connectors labeled I CH and Q CH These 50 Ohm inputs are intended to accept a low noise sine wave signals To accurately evaluate the dynamic performance of this converter the input test signals...

Page 5: ...t please contact you nearest National Semiconductor representative 5 1 Clock Jitter When any circuitry is added after a signal source some jitter is almost always added to that signal Jitter in a clock signal depending upon how bad it is can degrade dynamic performance We can see the effects of jitter in the frequency domain FFT as leakage or spreading around the input frequency as seen in Figure ...

Page 6: ...6 www national com 7 0 Schematic Drawing ADC081500DEV Onboard Clock VCO PLL ...

Page 7: ...7 www national com 7 1 Schematic Drawing ADC081500DEV Analog Inputs I Q Digital Trigger Input ...

Page 8: ...8 www national com 7 2 Schematic Drawing ADC081500DEV ADC connected to Virtex4 FPGA ...

Page 9: ...9 www national com 7 3 Schematic Drawing ADC081500DEV USB Interface ...

Page 10: ...10 www national com 7 4 Schematic Drawing ADC081500DEV Power Supplies 1 ...

Page 11: ...11 www national com 7 5 Schematic Drawing ADC081500DEV Power Supplies 2 ...

Page 12: ...12 www national com 7 6 Schematic Drawing ADC081500DEV Expansion Header Interface ...

Page 13: ...13 www national com 8 0 Bill of Materials Page 1 of 2 ...

Page 14: ...14 www national com 8 1 Bill of Material Page 2 of 2 ...

Page 15: ...ing the Wavevision 4 Software Ensure the board is connected to the 12V power supply included in the package and that the switch on the rear panel is pushed to the ON position The Green LED on the rear panel should be illuminated Connect the USB cable between the PC which has Wavevision 4 software installed and the ADC081500DEV board The USB port can also be found on the rear panel shown below If t...

Page 16: ... on the Settings pulldown menu and then click Capture Settings as shown below This will display the System Settings Window which should appear as below If the board has not been detected click the Test button under the Communication heading and the development board should be found If the communications fail check that the USB drivers are installed correctly then disconnect and re connect the USB ...

Page 17: ... board due to the ADC being single channel I and Q Display is not a valid selection I Q Interleaved is not a valid selection Temp Sensor Displayed below the Channel Selection tab is the die temperature of both the FPGA and the ADC Hardware Serial Control Hardware Pin Control The ADC is controlled by the logic states on the dedicated control pins The logic on these pins is determined by the setting...

Page 18: ...Sets the full scale range to 650mV pk pk 870mV Full Scale Sets the full scale range to 870mV pk pk The Following Pull down Tabs are available whether the Control mode is Hardware or Serial Standby Disable Standby Enable all on board power regulators Enable Standby Board is put into standby mode All power is shutdown except USB power PDQ Disable Q Shutdown Q Channel is not available Enable Q Shutdo...

Page 19: ...l Register Program the control panel display will be changed to the following view In this mode the register settings can be changed simply by clicking on the bits Doing so will toggle the bit value and any linear values such as Full Scale Range or Offset will automatically be updated The Reset Registers button at the bottom of the Control Panel will reset and write all the values to the power on ...

Page 20: ...n the board is in standby mode TRG TRIGGER EVENT illuminates when the Trigger Input makes low to high transition OVR ADC OVER RANGE Illuminates when the I or Q channel exceeds the full scale range of the ADC CLK CLOCK INPUT flashes with 50 duty cycle if the ADC is receiving a good clock input PWR POWER illuminates when the external 12V is connected and the system is not in Standby UPL UPLOAD illum...

Page 21: ...ATA BUS A N2 LVDS or CMOS C4 DATA BUS A P3 LVDS or CMOS D4 DATA BUS A N3 LVDS or CMOS C5 DATA BUS A P4 LVDS or CMOS D5 DATA BUS A N4 LVDS or CMOS C6 DATA BUS A P5 LVDS or CMOS D6 DATA BUS A N5 LVDS or CMOS C7 DATA BUS A P6 LVDS or CMOS D7 DATA BUS A N6 LVDS or CMOS C8 DATA BUS A P7 LVDS or CMOS D8 DATA BUS A N7 LVDS or CMOS C9 INPUT STROBE P D9 INPUT STROBE N C10 DATA BUS B P0 LVDS or CMOS D10 DAT...

Page 22: ...22 www national com 10 3 System Block Diagram ...

Page 23: ...s installed run the WaveVision installer again The installer will detect the Java software and configure the WaveVision software to use it Java technology can allow software to run on different platforms However the WaveVision software contains Windows specific hardware interface code and therefore is only currently supported under Windows 11 3 Automatic Device Detection Configuration The WaveVisi...

Page 24: ...move and edit annotations To edit an annotation double click it with the arrow tool To delete an annotation select it with the arrow tool and press the Delete key on your keyboard Line Annotation Tool To draw lines on the plot select this tool Drag to draw new lines To add arrowheads or fix the endpoints of the line double click it with the arrow tool Text Annotation Tool To draw labels on the plo...

Page 25: ...ays Clicking the FFT Options button at the top of the plot will display a dialog showing the options for that particular plot The software also maintains default options for new FFT plots which are editable You can edit the default FFT options by choosing Default FFT Options from the Settings menu The options are Windowing You may choose from one of five different window functions The window funct...

Page 26: ...t file The contents can be either a sample set or a histogram provided with or without time information The simplest example of this would be a file with a single column of samples You can open tab delimited text files by choosing Open from the File menu you can interleave data from multiple columns and or files You can choose ReOpen to reopen the same file later with the same settings for example...

Page 27: ...r sustain life and whose failure to perform when properly used in accordance with instructions for use provided in the labeling can be reasonably expected to result in a significant injury to the user 2 A critical component is any component in a life support device or system whose failure to perform can be reasonably expected to cause the failure of the life support device or system or to affect i...

Reviews: