


FX312 & FX412 VERSION 2.0
MLR ELECTRONIQUE
30
DISP.NSEW : you can choose to display the indications N (North), S (South), W (West) and E
(East) on the plotter screen to remind you its orientation.
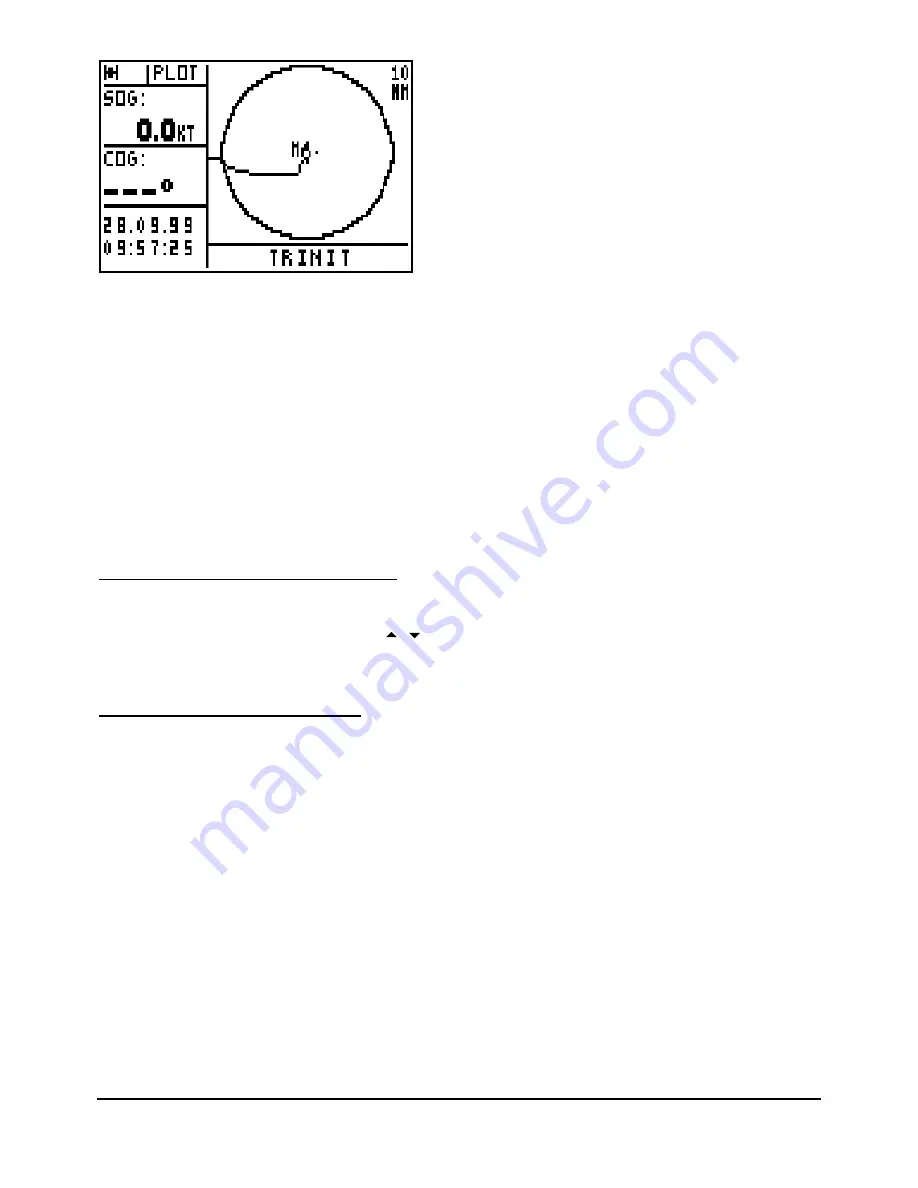
CIRCLE(S) : you can select to display none, 1 or 2 circles. The diameters of the circles are
shown either equal to the scale or alternatively half the scale.
WPT LINE : the WPT line is shown as a dotted line which starts at the vessel position when the
function was activated and it goes to the destination waypoint (GO TO WAYPOINT function).
This is the active waypoint in the GOTO route function. This is the reference line used for
calculating the cross track error.
ZOOM : you have the option of displaying the value of the scale on the top right of the
PLOTTER screen.
ZONES 1, 2 and 3 : you can select information displayed in these 3 zones from the Plotter set
up menu.
5.5. – DISPLAY THE CHART OUTLINE
From the PLOTTER function, press the Menu key and press the key 4 (or select 4-DISP.
CHART and press Enter). Using the
arrow keys select the option CHART ON to display
the chart outline and press Enter.
5.6. – ENTER A CHART OUTLINE
This function allows you to produce a chart outline from a paper chart with paper chart plotter or
to be loaded from a PC by using the software PMS, WAYPOINTS & ROUTES. This chart
outline can be displayed in the plotter function of your GPS.
To enter your chart outline, connect a YEOMAN plotter (see the connection in the installation
paragraph) to your receiver. To be used with the MLR DIGIPOINT, see paragraph B.10 and the
user manual of your DIGIPOINT.
From the PLOTTER function, press the Menu key and press the key 5 (or select 5-ENTER
CHART and press Enter): The chart options menu is now displayed.
Use keys 0, 1, 2, 3 and 4:
0 - TYPE OF LINE, to select the type of line.
1 - DELETE LAST WAYPOINT, to erase the last received point in case of mistake.
2 - END OF LINE, to stop a line and to begin a new line.
3 - DISPLAY CHART, to display the outline
4 - SAVE CHART OUTLINE, to validate and store the chart outline.