miniDSP Ltd, Hong Kong /
/ Features and specifications subject to change without prior notice
32
5.3
D
ESIGNING YOUR TARGET CURVE
The target curve is the desired in-room frequency response with the nanoAVR DL processor performing digital
room correction.
5.3.1
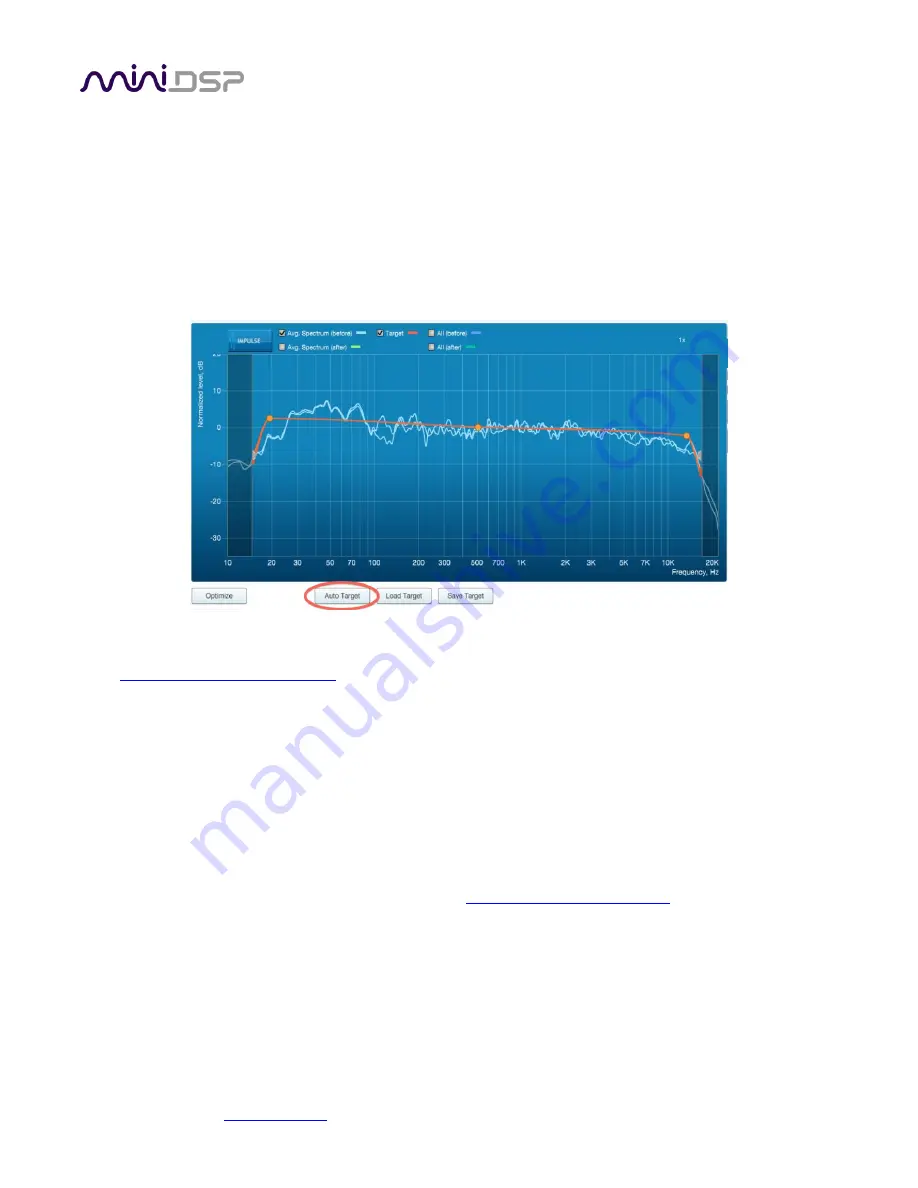
The Auto Target
When first viewing the Filter Design tab, an estimated target curve suitable for your speakers is shown as the
red curve. This calculated target curve can be restored at any time by clicking on the Auto Target button.
Note: restoring the auto target will erase the current target curve. If you wish to keep it, you can save it to a file
– see
Saving and loading target curves
5.3.2
Editing the target curve
You can edit the target curve to produce any desired magnitude response. This is done with the use of anchor
points, shown as orange dots on the curve:
Drag an anchor point to move it.
Double-click on the target curve to add an anchor point.
Double-click on an anchor point to delete it.
If channels are linked, the same target curve is used for that group of linked channels. To create a separate
target curve for a single channel, unlink it as described in
Linking and unlinking channels
5.3.3
Changing the frequency range for correction
The regions to the left and right of the response graphs that are shaded in a darker color are excluded from
magnitude response correction. Dirac Live chooses a suitable range by default, but you can adjust this range for
your system and preferences. For example, low-frequency noise (traffic, machinery) may be present in some
environments, so it is best to adjust the frequency range to exclude these frequencies from the correction. Or,