43
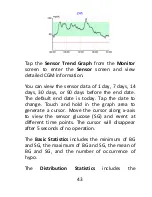
Tap the
Sensor Trend Graph
from the
Monitor
screen to enter the
Sensor
screen and view
detailed CGM information.
You can view the sensor data of 1 day, 7 days, 14
days, 30 days, or 90 days before the end date.
The default end date is today. Tap the date to
change. Touch and hold in the graph area to
generate a cursor. Move the cursor along x-‐axis
to view the sensor glucose (SG) and event at
different time points. The cursor will disappear
after 5 seconds of no operation.
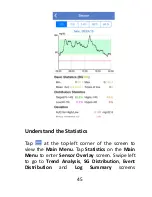
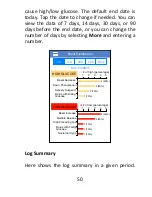
The
Basic Statistics
includes the minimum of BG
and SG, the maximum of BG and SG, the mean of
BG and SG, and the number of occurrence of
hypo.
The
Distribution Statistics
includes the
Summary of Contents for S6 EasySense
Page 1: ...S6 EasySense Disposable CGM System User Guide...
Page 3: ......
Page 7: ...3...
Page 24: ...16...
Page 78: ...70 Remote View Permission Family1 Family 3 Edit Delete...
Page 79: ...71...
Page 91: ...83 Type BF equipment Protection from electrical shock...
Page 98: ...90 UG883013 348010...


