


Mantracourt Electronics Limited
– FSU User Manual
18
Navigation
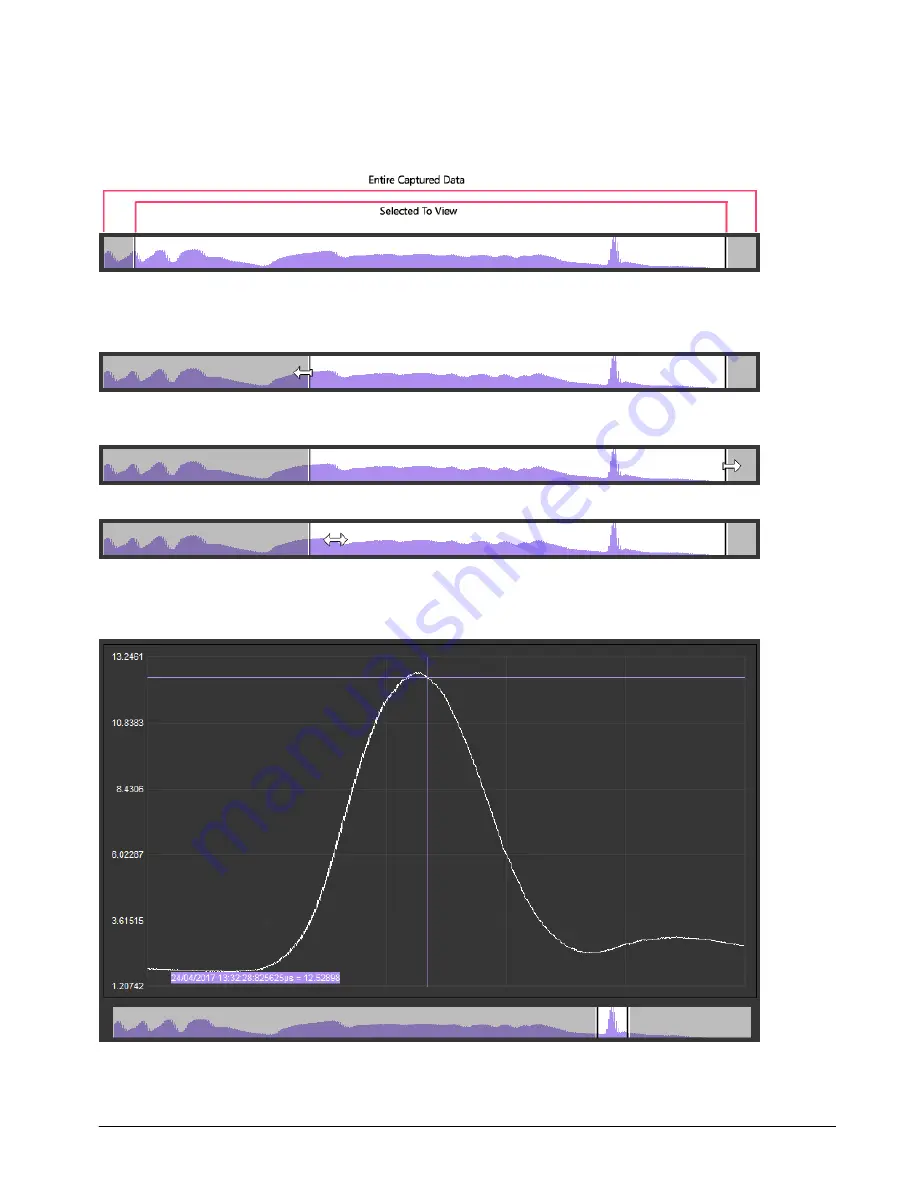
The data navigation bar sits under the chart. The entire set of captured data is represented in the background
coloured purple. The lighter highlighted part shows the selected portion that is currently being displayed in the
chart. Thus the navigation control allows you to zoom in and out of the data as well as pan along through the data at
the current zoom level.
You can change the viewed data by dragging the highlighted portion as follows:
Expand or contract the highlight by clicking and dragging the cursor at the left-hand side of the highlight or
anywhere to the left of the highlight.
Expand or contract the highlight by clicking and dragging the cursor at the right-hand side of the highlight or
anywhere to the right of the highlight.
Or you can pan the highlight left and right by clicking and dragging in the middle of it.
Cursors
Left clicking on the chart will display the first cursor. The cursor snaps to the nearest data point and displays the data
and time and value of the data point in a box in the lower left of the chart.
The date is followed by the time in
HH:MM:SS:microseconds
format then the value.
Cursors are turned off once the navigation control is used.


