Technical Description &
Configuration Guide
Performance
and Alarm Management
LigoWave
Page 67
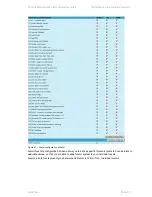
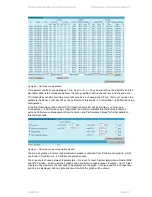
Figure 45
– Performance log window
Time interval can be chosen between 1 min, 15 min or 1 hr. You can also define the start time and the
start date. When start values are defined, it is also possible to define the end time and the end date.
TS (threshold seconds) show the amount of seconds in a chosen period (1min, 15min or 1h) when the
parameter had been out of bound
s set by performance thresholds in „Configuration
Performance log
configuration‟.
To define thresholds outside of which TS (threshold seconds) will be counted, you must go to
„Configuration
Performance log configuration‟ and enter preferable threshold values. Refer to
sections
Performance Management Data Collection
and Performance Values for further details on
threshold seconds.
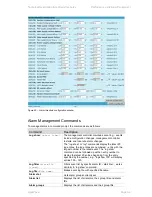
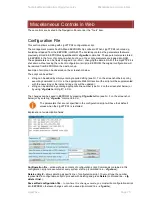
Figure 46
– Performance log configuration window
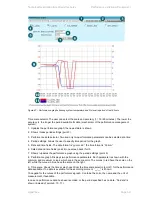
The main advantage in terms of demonstration means is obtained from „Performance graphs‟, which
are found in „Performance
Performance graph‟ section.
You are able to choose between 5 parameters
– Rx level; Tx level; System temperature; Radial MSE
and LDPC stress
– and to view their graphs. It is possible to choose between 8 scales – from 12 last
minutes to the maximum of 6 last days to be displayed in the graph. It is also possible to choose time
period to be displayed, defining date and time till which the graph will be shown.

